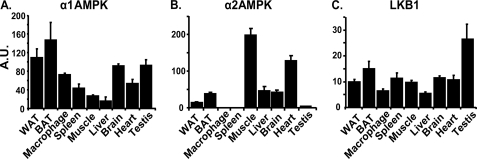
FIGURE 1.
Tissue distribution of α1AMPK (A), α2AMPK (B), and LKB1 (C). Total RNA was isolated from individual tissues and the expression of α1AMPK, α2AMPK, and LKB1 was measured by real time RT-PCR and normalized to cyclophilin. BAT, brown adipose tissue; Macrophage, thioglycollate-elicited peritoneal macrophage. Data are expressed as mean ± S.E., n = 3. A.U., arbitrary units.

