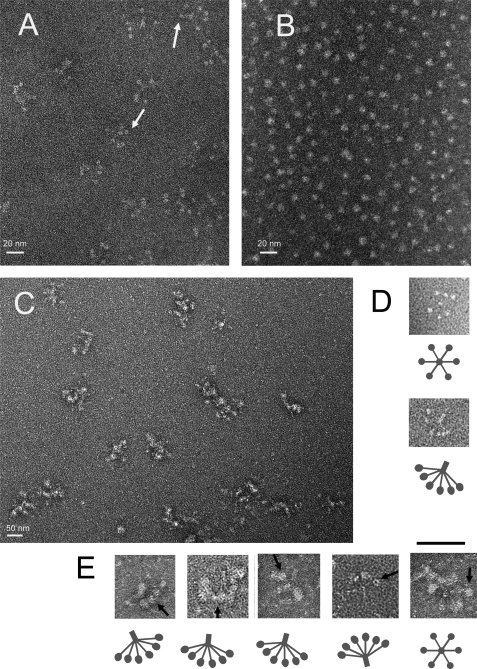
FIGURE 5.
Electron microscopy analysis of C1q, PrP type II oligomers, and C1q-PrP complexes. Samples were negatively stained using 2% uranyl acetate or 1% ammonium molybdate. A, overall view for purified C1q. White arrows indicate examples of globular head regions of C1q. B, overall view for SEC-purified PrP type II oligomers (diameter of 5–8 nm). C, overall view of purified C1q-PrP complexes taken from fraction 2 of the SEC shown in Fig. 4B. The proteins are present in clusters. D, detailed top view and side view of C1q. The clear dots represent the GH domains with a diameter of ∼4 nm. E, detailed side views and one top view of purified C1q-PrP complexes. Black arrows indicate examples of PrP bound to C1q GH. The scale bar between D and E represents 50 nm.

