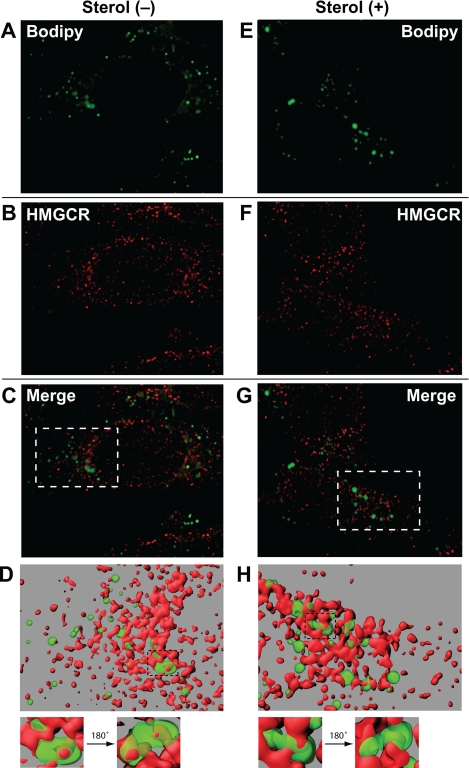
FIGURE 4.
Association of MG-132-induced lipid droplets with ER membranes containing HMG-CoA reductase. On day 0 CHO-K1 cells were plated at 5 × 10⁴ cells per well of 12-well plates with glass coverslips. On day 1 cells were refed medium A supplemented with 5% LPDS, 10 μm compactin, and 50 μm mevalonate. After 16 h at 37 °C, cells were switched to medium A containing 5% LPDS, 10 μm compactin, and 10 μm MG-132 in the presence or absence of 1 μg/ml 25-hydroxycholesterol plus 10 mm mevalonate as indicated. After incubation for 5 h at 37 °C, cells were washed twice with PBS, fixed with 4% paraformaldehyde, permeabilized with 0.1% Triton X-100, and stained with 10 μg/ml BODIPY 493/503 to visualize lipid droplets (green) and with 50 μg/ml IgG-A9 with 5 μg/ml AlexaFluor 568 goat anti-mouse IgG to visualize reductase (HMGCR; red) using standard procedures. Images were taken using a Deltavision pDV deconvolution microscope (Bitplan, Inc., St. Paul, MN) with an Olympus UPlanApo 100× oil immersion objective. Z slices were taken at 0.2-μm intervals through the thickness of the cell (∼25 slices) and were deconvolved using SoftWoRx software using the default settings. The middle five slices of the deconvolved Z stack were used to generate surface volume renderings using Imaris software (Bitplane, Inc.). Segmentation was carried out interactively to obtain surfaces that most closely matched the localization of lipid droplets and reductase staining. The green surface was rendered at 45% transparency to reveal red structures contained within green structures. The maximum intensity projection of the Z slices are shown in A–C and E–G. The surface volume renderings are shown in D and H.

