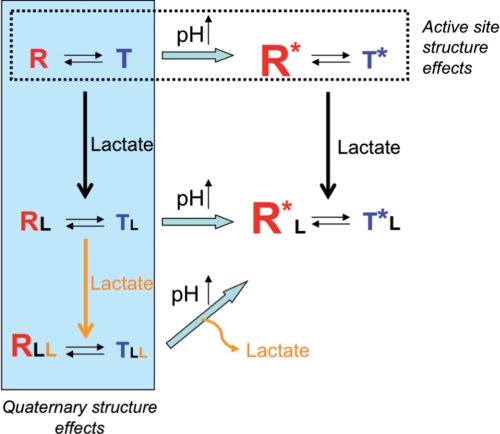
FIGURE 5.
Schematic representation of the pH and l-lactate effects on the structure-function relationships in Hc. The effect of pH is illustrated horizontally across the top of the scheme, whereas the effect of increasing l-lactate concentration is shown vertically on the left side. The size of the letters R and T represents the amount of these forms. The R* and R represent the two high affinity forms at high and low pH, respectively.

