Abstract
The retina-specific ATP-binding cassette (ABC) transporter, ABCA4, is essential for transport of all-trans-retinal from the rod outer segment discs in the retina and is associated with a broad range of inherited retinal diseases, including Stargardt disease, autosomal recessive cone rod dystrophy, and fundus flavimaculatus. A unique feature of the ABCA subfamily of ABC transporters is the presence of highly conserved, long extracellular loops or domains (ECDs) with unknown function. The high degree of sequence conservation and mapped disease-associated mutations in these domains suggests an important physiological significance. Conformational analysis using CD spectroscopy of purified, recombinant ECD2 protein demonstrated that it has an ordered and stable structure composed of 27 ± 3% α-helix, 20 ± 3% β-pleated sheet, and 53 ± 3% coil. Significant conformational changes were observed in disease-associated mutant proteins. Using intrinsic tryptophan fluorescence emission spectrum of ECD2 polypeptide and fluorescence anisotropy, we have demonstrated that this domain specifically interacts with all-trans-retinal. Furthermore, the retinal interaction appeared preferential for the all-trans-isomer and was directly measurable through fluorescence anisotropy analysis. Our results demonstrate that the three macular degeneration-associated mutations lead to significant changes in the secondary structure of the ECD2 domain of ABCA4, as well as in its interaction with all-trans-retinal.
Keywords: ABC Transporter, Circular Dichroism (CD), Fluorescence, Retina, Vision, ABCA4, ABCR, Extracellular Domain, Macular Degeneration, Stargardt Disease
Introduction
ABC3 transporters are required for transport of a wide variety of hydrophobic substances across cellular membranes, including drugs (1–3), lipids (4–6), metabolites, peptides (7), and steroids (2). Typically, eukaryotic ABC proteins are composed of two tandem sets of six transmembrane helices followed by a Walker type A and a type B nucleotide-binding motif (8). To date, 48 members of the human ABC transporter family have been identified, which, based on sequence homology, have been divided into seven subfamilies, ABCA through ABCG (2–3, 9).
A retina-specific variant of the ABCA subfamily, the ABCA4 gene product (ABCR), was first described as the bovine and Xenopus Rim proteins identified in the rims of the rod outer segment discs (10–11). Mutations in the ABCA4 gene appear to lead to defects in the energy-dependent transport of all-trans-retinal and lead to the accumulation of cytotoxic lipofuscin fluorophores in the retinal pigment epithelium characteristic of the diseases such as Stargardt disease, fundus flavimaculatus, and autosomal recessive cone-rod dystrophy, as well as increased susceptibility to age-related macular degeneration (12–20). Although ultimately these diseases await the promise of a cure through gene therapy (21–22), current treatments have been directed toward slowing the progression of the disease. Consequently, understanding how genetic mutations lead to retinal degeneration is critical for the development of novel therapies.
Studies in several laboratories and the establishment of ABCA4 screening consortiums have aided in the identification of over 500 mutations in the ABCA4 gene that are associated with a plethora of visual diseases. A genotyping microarray chip has been developed for the ABCA4 gene that can robustly identify >98% of the existing mutations (23). Disease-associated ABCA4 alleles have shown an extraordinary genetic heterogeneity. Some of these mutations map to the nucleotide binding domains (NBDs), suggesting that the underlying defect has a basis in nucleotide hydrolysis and/or aspects of energy transduction related to transport. However, the fact that ABCA4 mutations occur throughout the entire open reading frame suggest that defects in ATP hydrolysis only are one of the causes of these diseases. At present, the biochemical basis of functional defects due to mutations in domains other than the NBDs remains refractory to biochemical analysis, primarily because these domains lack any known enzymatic function.
Structural topology varies significantly between the eight subclasses of ABC transporters. In the ABCA subfamily, each half-transporter contains a transmembrane domain (TMD) composed of six membrane-spanning units, followed by a cytoplasmic or soluble domain. In addition, each ABCA half-transporter possesses a large extracellular loop, which is characteristic of this subfamily. In the case of ABCA4, several models of membrane topology have been proposed based on hydropathy profiles, and experimental data support the notion that two large extracellular domains (ECDs) are present (24). The extracellular loops project from TMD1 for ECD1 and from TMD7 for ECD2; they represent significantly large polypeptide domains, with 603 residues for ECD1 (amino acids 43–646) and 285 residues for ECD2 (amino acids 1395–1680). The high degree of sequence conservation observed in the ECDs of vertebrate ABCA4 proteins suggests an important physiological significance (20, 25).
In the absence of any known enzymatic or functional motif, it has been difficult to assess the significance of disease-associated mutations in the ECD domains of ABCA4. Expression and characterization of individual functional domains have been demonstrated to be a viable approach utilized by several laboratories working with other ABC proteins, such as the MDR1 and cystic fibrosis transmembrane regulator transporters (26–29). ABCA4 is a particularly large membrane protein (∼220 kDa), which is fairly unstable as a recombinant whole molecule. Consequently, systematic analysis of the structure and function of each individual domain in recombinant form is a highly viable and specific approach, as demonstrated by our previous studies with the NBD1/NBD2 domains of ABCA4. Previously, we were able to delineate the structural and functional specificities of the individual nucleotide binding domains, which would not have been possible using the full-length ABCA4 protein (30–32).
Fluorescence and CD spectroscopic methodologies have been utilized as valuable tools for the characterization of structure and function of a variety of proteins, including ABC transporters (33–35). In this study, we have employed these techniques to elucidate the structural features and functional properties of the second extracellular loop of ABCA4 as well as to delineate the effects of disease-associated mutations in the ECD2 domain.
EXPERIMENTAL PROCEDURES
Nucleic Acids, Enzymes, and Other Reagents
The pRK5 plasmid containing the full-length, wild type cDNA of the human ABCA4 gene was obtained as a generous gift from Drs. J. Nathans and Michael Dean of The Johns Hopkins University (Baltimore, MD) and NCBI (Frederick, MD), respectively. The T7 expression system vector pET30b, Bug Buster protein extraction reagent, Benzonase® nuclease, and the S-protein-agarose affinity resin were from Novagen (EMD Sciences, Briggstown, NJ). All-trans retinal was from Sigma, and 11-cis-retinal was synthesized by Toronto Research Chemicals, Canada.
Buffers
Buffer A contained 20 mm Tris-HCl (pH 8.0), 100 mm NaCl, 2 mm dithiothreitol, and 15% (v/v) glycerol. Buffer B contained 20 mm Tris-HCl (pH 7.5), 1 mm MgCl2, 50 mm NaCl, 5% glycerol, and 0.01% Nonidet P-40. Buffer C contained 6 m guanidine hydrochloride, 0.1 m Tris-HCl (pH 8.0), and 2 mm EDTA. Buffer D contained 0.1 m Tris-HCl (pH 8.0), 0.5 m l-arginine, and 2 mm EDTA. Buffer E contained 10 mm NaPO4 (pH 7.4), 25 mm NaCl, and 2 mm dithiothreitol.
Design and Cloning of the Construct Containing ECD2
The ECD2 construct was amplified from full-length ABCA4 cDNA and cloned into pET30b T7 expression vector (EMD Sciences) using standard recombinant DNA technology (36). This domain corresponds to a 31.8-kDa (285 amino acids) polypeptide. The cloning was designed such that the polypeptide was produced as an S-tagged fusion protein, leading to a predicted mass of 34.4 kDa for the recombinant ECD2. For subsequent recombinant protein expression, the plasmid was used to transform Escherichia coli strain BL21-CodonPlus(DE3)-RILP competent cells (Stratagene, La Jolla, CA).
In Vitro Site-directed Mutagenesis of the ECD2 Construct
Site-directed mutagenesis was carried out using a PCR-based mutagenesis kit (Stratagene, La Jolla, CA) (32) and the pET30-ECD2 plasmid as template. The complementary oligonucleotides were used as mutagenic primers to generate the mutant ECD2 proteins as detailed in Table 1. The authenticity of the mutations and the absence of other fortuitous mutations were confirmed by DNA sequencing carried out by Eurofins MWG/Operon (Huntsville, AL).
TABLE 1.
Stargardt disease-associated mutations occurring in the ECD2 domain investigated in this study
| Mutation | Base change | Mutagenesis primer |
|---|---|---|
| R1443H | CGC4328CAC | 5′-CAGGCTTTGGCAACCACTGAAGGAAGGGTGGCTTC-3′ |
| W1408L | TGG4221TTG | 5′-ACCCTTCACCCCTTGATATGGGCAGCAGTACACCTTC-3′ |
| C1488R | TGC4462CGC | 5′-AACCCTTCACCATCCCGCAGGTGCAGCACCAGGGAGAAG-3′ |
Overexpression of pET30b-ECD2 in E. coli
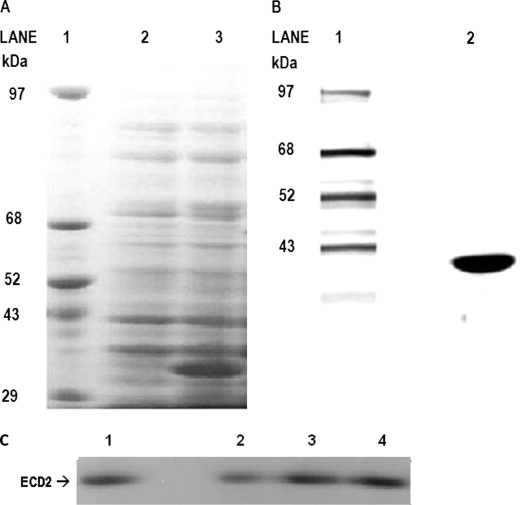
E. coli cells (strain BL21-CodonPlus(DE3)-RILP, Stratagene, La Jolla, CA) harboring pET30b-ECD2 plasmid were used to produce the recombinant ECD2 polypeptide following the manufacturer's instructions. The expressed recombinant polypeptide appeared to be of the anticipated size (34 kDa), as determined by SDS-PAGE (Fig. 3A).
FIGURE 3.
Purification of ABCA4-ECD2 protein. A, overexpression of ABCA4-ECD2 polypeptide. SDS-PAGE analysis of the overexpressed ECD2 polypeptide in E. coli. Expression of the recombinant protein was carried out as described under “Experimental Procedures” in the presence of 0.25 mm isopropyl 1-thio-β-d-galactopyranoside. Equal amounts of cells before and after induction were analyzed. Lane 1, protein molecular mass standard; lane 2, uninduced RIPL (DE3)/pET30b ECD2 cell lysate; and lane 3, cell lysate from isopropyl 1-thio-β-d-galactopyranoside induced RIPL (DE3)/pET30b ECD2. B, ECD2 polypeptide purified by S-protein-agarose chromatography. SDS-PAGE of S-protein-agarose purification of ECD2. An aliquot (corresponding to 10 μg) of purified ECD2 was analyzed on a 5–18% SDS-polyacrylamide gel that was stained with Coomassie Blue R-250 following electrophoresis. C, ECD2 wild type and mutant purified refolded polypeptides. Approximately 4.5 μg of the respective purified, refolded protein was loaded onto a 5–18% SDS-PAGE, which was stained with Coomassie Blue R-250 following electrophoresis. As shown, the ABCA4-ECD2 protein migrated with predicted molecular mass of ∼34 kDa.
Extraction and Purification of Recombinant ECD2 Proteins
Extraction and purification of wild type ECD2 protein carrying the S-tag using immobilized S-protein-agarose affinity resin (EMD Chemicals, Gibbstown, NJ) followed the manufacturer's recommendations as described previously (30).
Purification of ECD2 Polypeptide from Solubilized Inclusion Bodies
Introduction of mutations into wild type ECD2 polypeptide appeared to decrease the solubility of the expressed proteins as determined by SDS-PAGE and Western blot procedure (data not shown). Consequently, we explored the extraction of recombinant proteins (wild type and mutants) from the inclusion bodies followed by refolding (37). This approach has been shown to be highly successful in the purification of a number of ABC transporters (32, 38–40).
The wild type and mutant ECD2 proteins were extracted from inclusion bodies using a protocol, which combines the use of BugBuster protein extraction reagent (Novagen, Madison, WI), to process the insoluble fraction and yield purified inclusion bodies, with the method described previously (32, 38, 41). After harvesting the expressed proteins, the cell pellets were resuspended in room temperature BugBuster reagent, and protease inhibitors were added. After incubation on ice for 30 min, the cell suspension was centrifuged to collect purified inclusion bodies. Following cell lysis, the pellet of inclusion bodies was resuspended in Buffer B and centrifuged once more. The inclusion body proteins were solubilized in Buffer C. Protein refolding was achieved by rapid dilution in Buffer D. The renatured protein was sequentially dialyzed in Buffer E. After overnight dialysis, proteins were concentrated to ∼0.5 mg/ml by ultrafiltration (Amicon/Millipore). Overall, the inclusion body protein purification methodology described here yielded highly concentrated, purified, and homogeneous preparations of protein. The yield of ECD2 protein was >10 mg from 4 liters of induced cell culture. Purified proteins were stored at-80 °C until use.
Circular Dichroism Spectropolarimetry
Spectra were collected on a Jasco-810 spectropolarimeter (X-ray and Structure Core Facility, Thomas Jefferson University) using a 2-mm path length cell, and the temperature was maintained at 25 °C, or the indicated temperature, using a Peltier controlled cuvette holder. Spectra were the average of five scans collected at a speed of 10 nm/min. Unless otherwise indicated, protein concentrations were 0.1 mg/ml in 10 mm NaPO4 (pH 7.5), 25 mm NaCl. Buffer spectra were always subtracted. CD spectra were analyzed using the K2D2 method with its associated web server to estimate protein secondary structure (42–43).
For thermal melting experiments, the ellipticity at 220 nm was monitored over a temperature range of 20–80 °C, using a resolution of 0.2 °C, a bandwidth of 1 nm, and a temperature gradient of 1 °C min−1. Global analysis of the data was conducted using the PRISM program (GraphPad Software, Inc.).
Steady-state Fluorescence Measurements
Fluorescence experiments were performed using a Fluorolog-3 spectrofluorometer (Jobin Yvon Horiba Inc., Edison, NJ), and measurements were made in an L-format configuration of excitation and emission channels. The excitation wavelength was set to 295 nm to avoid excitation of either tyrosine or phenylalanine residues. Emission was scanned from 320 to 400 nm. Excitation and emission slits were set at 8 and 4 nm, respectively. The spectra of the ECD2 polypeptide were measured in a 0.1 mg/ml solution in Buffer E.
Changes in steady-state fluorescence were used to monitor interaction with all-trans- and 11-cis retinal over a concentration range of 0–15 μm. Titrations with increasing amounts of all-trans-retinal were conducted, and emission scans from 320 to 400 nm were taken at each concentration. Fluorescence data were normalized to 0–100 arbitrary units for wild type ECD2 and each mutant. A semilog plot of emission at 333 nm versus log [all-trans-retinal] was fitted to the sigmoidal dose-response Equation 1,
where y is the fluorescence intensity, and x is the log of the all-trans-retinal concentration.
Anisotropy Measurements
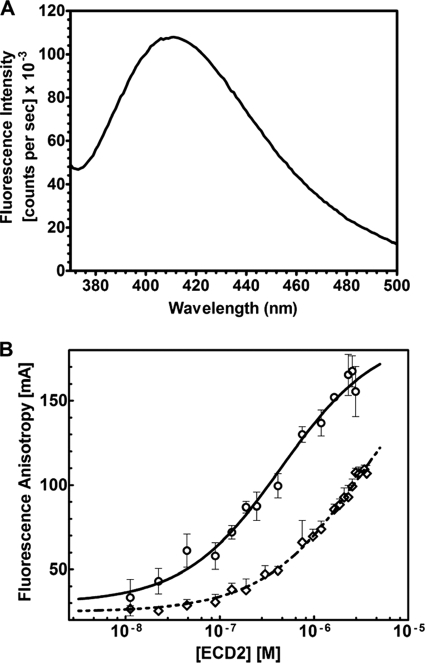
To determine the appropriate emission/excitation parameters for anisotropy measurements involving all-trans-retinal, an emission scan following excitation at 310 nm was conducted. Following excitation of 100 nm all-trans-retinal at 310 nm, emission scans were collected over the range of 370–570 nm. The 100 nm solution of all-trans-retinal was then titrated with ECD2 polypeptide over the range of 0 to 0.1 mg/ml protein. Anisotropy measurements were made in an ISS PC1 photon counting spectrofluorometer equipped with Glan Thompson polarizers (ISS Inc., Urbana-Champaign, IL). The temperature was maintained at 25 °C using a Peltier controlled cuvette holder. Anisotropy runs were collected in triplicate. Anisotropy values were expressed as millianisotropy, or mA (anisotropy divided by 1000). The standard error for the measured anisotropy values was ±3 mA. An anisotropy reading for each titration point was taken three times for 10 s and averaged. The total fluorescence intensity did not change significantly with an increase in the ECD2 concentration. Therefore, fluorescence lifetime changes, or the scattered excitation light, did not affect the anisotropy measurements. Anisotropy, A, is defined as shown in Equation 2,
where G is the instrumental correction factor for the fluorometer, and it is defined as follows: G = Ihv/Ihh, where, Ivv, Ivh, Ihv, and Ihh represent the fluorescence signal for excitation and emission with the polarizers set as follows: 0°, 0°; 0°, 90°; 90°, 0°; and 90°, 90°, respectively.
The interaction of ECD2 with all-trans-retinal (ATR) can be represented as ECD2 + ATR ⇋ ECD2·ATR. At equilibrium, Ka, the equilibrium association constant, can be given as shown in Equations 3 and 4,
The fraction of the bound ligand, f, can be represented as shown in Equation 5,
 |
Substituting for [ECD2] and rearranging Equation 5, we get Equations 6 and 7,
Similarly, the equilibrium dissociation constant Kd can be expressed, substituting Kd for 1/Ka, as shown in Equation 8,
At Af = 0.5, Kd = [ECD2]. Thus, Kd can be further defined as the protein concentration at which half of the sites are occupied when the ligand concentration is constant as in the present case or the ligand concentration at which half of the sites are occupied when the protein concentration is constant. Analysis of the data were conducted using PRISM (GraphPad Software Inc., San Diego). The Kd value, i.e. the concentration of ECD2 required to bind 50% of the ligands, was computed using Equation 9,
where Amin and Amax are the anisotropy values at the bottom and top plateaus, respectively; X represents the log of the ECD2 concentration; Kd is the X value when the response is halfway between the top and the bottom, and napp is the Hill coefficient.
Other Methods
Routine protein concentrations were determined by the method of Bradford (44) using bovine serum albumin as a standard and for the CD/fluorescence studies using molar extension coefficient measurements ϵECD2 = 49,180. SDS-PAGE was carried out as described by Laemmli (45).
RESULTS
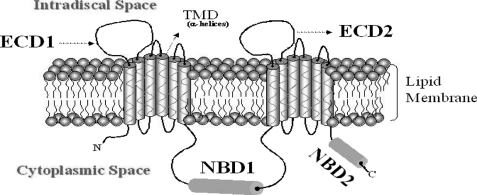
The long extracellular loops, or domains, are a distinctive topological feature of the ABCA subfamily of transporters, yet at the present time their structure and function remain unknown. Based on current models (Fig. 1), the ECD1 domain of ABCA4 is defined as projecting from TMD1 (amino acids 43–646), and ECD2 projects from TMD7 (amino acids 1395–1680). We have calculated the grand average of hydropathicity indexes (GRAVY) for ECD1 and ECD2. GRAVY analysis of the domains were found to be −0.294 and −0.356 for ECD1 and ECD2, respectively (ProtParam, ExPASy Proteomics Server). A negative value corresponds to a hydrophilic polypeptide, although a positive value corresponds to hydrophobic polypeptide, and thus the values are consistent with the postulated projection of these domains into the aqueous environment of the lumen of the rod outer segment discs (Fig. 1) (46).
FIGURE 1.
Predicted structural organization of ABCA4 and its domains. Pictorial representation showing the cytoplasmic, extracellular, and transmembrane domains of the ABCA4 protein. The domains were defined based on current topological models of ABCA4 (24) and are as follows: NDB1 amino acids 854–1375, NBD2 amino acids 1898–2273, ECD1 amino acids 62–646, and ECD2 amino acids 1395–1680.
Stargardt Disease Mutations Affecting Conserved Residues of ECD2
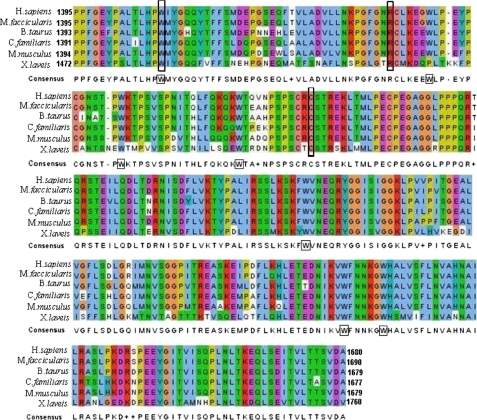
Sequence alignment of the second extracellular loop of ABCA4 demonstrates that this domain is highly conserved. The ECD2 domain contains seven tryptophan residues, six of which are strictly conserved among the species examined (Fig. 2). Several macular degenerative disease-associated mutations map to the ECD2 domain of ABCA4 (13, 23, 47–49), pointing to its likely significance in ABCA4 function. Three ABCA4 mutations associated with Stargardt disease, W1408L, R1443H, and C1488R, were chosen for analysis in this study. These missense mutations have been observed to occur in patients as simple and/or compound heterozygotes (Table 1). Sequence alignments of the ECD2 domains of ABCA4 proteins were carried out to determine the degree of conservation of these specific amino acid residues among the ECDs of several organisms. All three of the mutations correspond to strictly conserved amino acids in vertebrate ABCA4 proteins (Fig. 2).
FIGURE 2.
Sequence alignment of ECD2 domains of ABCA4 proteins derived from several vertebrate species. The amino acid sequences of several vertebrate organisms were obtained from NCBI as follows: Homo sapiens (human), Macaca fascicularis (crab eating macaque), Bos taurus (bovine), Canis familiaris (dog), Mus musculus (mouse), and Xenopus laevis (African clawed frog), and were aligned using ClustalW. The amino acid residue number for each protein is indicated at the beginning of each sequence. The alignment is color-coded to indicate chemical characteristics of a given amino acid as follows: red, basic; blue hydrophobic; green, hydrophilic; orange, neutral; pink, acidic; and light green, proline. Missense mutations examined in this study are enclosed by boxes. Tryptophan residues present in hABCA4 are shown in boxes within the consensus sequence.
Conformational Analysis of Native and Refolded ECD2 Polypeptides Suggests a Highly Ordered Structure
The structural characteristics of native and refolded recombinant ECD2 polypeptides were evaluated by comparing their CD spectra in the far-ultraviolet region (200–250 nm). Highly purified homogeneous preparations of recombinant ECD2 protein were used for CD analysis (Fig. 3). Secondary structures were determined using K2D2 neural network-based analysis (42).
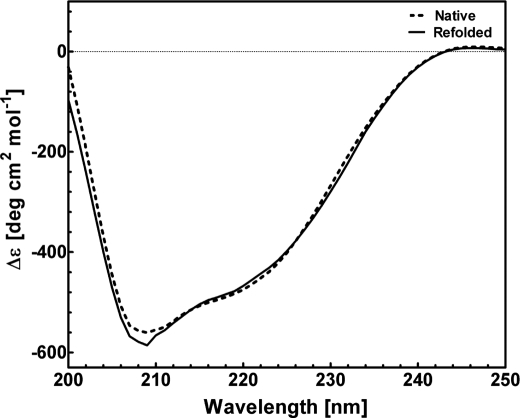
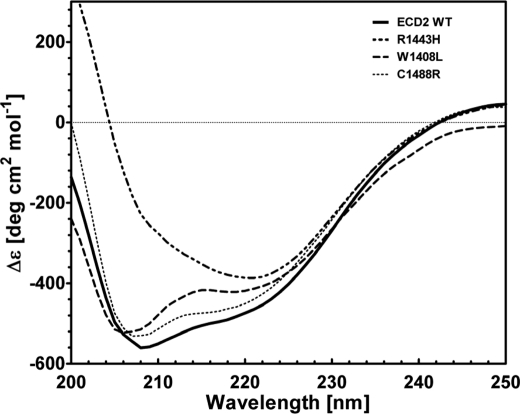
The CD spectra of the native and refolded ECD2 polypeptides are presented in Fig. 4. The two spectra were essentially identical and were typical of structurally ordered proteins, containing α-helical, β-sheet, and extended coil structures. Both CD spectra had two minima observed at 208 and 222 nm, characteristic of α-helical structure (Fig. 4). Nonlinear regression analysis of the CD spectra provided an estimation of ECD2 secondary structure, 25 ± 3% α-helix and 20 ± 3% β-sheet, respectively (Table 2). These results suggest that the structure of the refolded ECD2 polypeptide is essentially the same as that of the native ECD2 protein. We have analyzed changes in the conformation of ECD2 protein harboring disease-associated mutations W1408L, C1488R, and R1443H. The secondary structures of these proteins were then compared with the wild type polypeptide (Figs. 5 and 6).
FIGURE 4.
Circular dichroism spectra of native and refolded ABCA4-ECD2 polypeptides. Comparative far-UV (200–250 nm) CD spectra of ECD2 from S-tag agarose and refolding-based purifications. The concentration of ECD2 polypeptide was 0.1 mg/ml in 10 mm NaPO4 (pH 7.5), 25 mm NaCl. Native S-protein-agarose chromatography is shown by dashed line and refolded by solid line.
TABLE 2.
Summary of the secondary structure for ECD2 polypeptide
| ECD2 protein | Secondary structure |
||
|---|---|---|---|
| α-Helix | β-Sheet | Extended coil | |
| Affinity-purified | 0.27 | 0.20 | 0.53 |
| Refolded | 0.25 | 0.20 | 0.55 |
FIGURE 5.
Circular dichroism spectra of wild type and mutant ABCA4-ECD2 polypeptides. CD spectra were collected from highly purified homogeneous preparations of recombinant wild type (WT) and mutant ECD2 polypeptides. Far-UV (200–250 nm) CD spectra were acquired as described under “Experimental Procedures.” The concentrations of ECD2 polypeptides were 0.1 mg/ml in 10 mm NaPO4 (pH 7.5), 25 mm NaCl.
FIGURE 6.
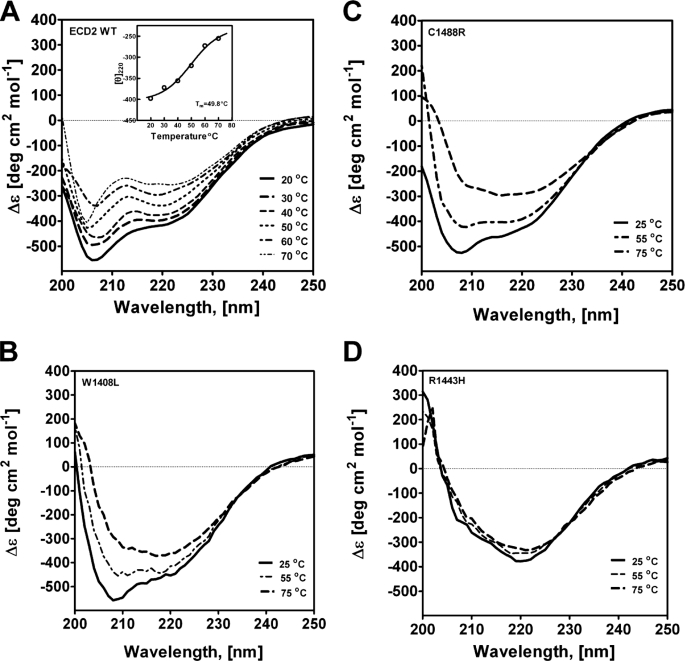
Circular dichroism spectra of wild type and mutant ABCA4-ECD2 polypeptides as a function of temperature. CD spectra were acquired (200–250 nm) over the range of 20–80 °C, at 10 °C increments, using a resolution of 0.2 °C. The concentrations of ECD2 wild type (WT) and mutant polypeptides were 1 μm in 10 mm NaPO4 (pH 7.5), 25 mm NaCl. The spectra were acquired and analyzed as described under “Experimental Procedures.” A, wild type ECD2 ; inset, ellipticity at 220 nm was monitored over the range of 20–80 °C, and the Tm was determined from the inflection points of data fitted to sigmoidal curve; B, W1408L; C, C1488R, and D, R1443H.
W1408L Mutation
The W1408L mutation has been reported in several studies investigating the ABCA4 genotype of individuals afflicted with Stargardt disease, fundus flavimaculatus, and cone rod dystrophy (13, 19, 48). This mutation has been identified in patients with and without the occurrence of a second ABCA4 mutation occurring in trans. Alone, this mutation leads to late onset (30 years of age) of Stargardt disease, although patients harboring a second ABCA4 mutation in trans may manifest as early onset (12 years of age) cases of the disease. The Trp → Leu mutation represents a relatively significant mutation, in terms of structure and polarity. In addition, the aromatic residue, with its large hydrophobic surface present in tryptophan, represents a potential “hot spot” for protein-protein and protein-ligand interactions and may thus alter the biological function of this domain (50). The far-UV CD spectrum of the mutant ECD2 was similar to that of the wild type protein suggesting that this mutant maintained most of the secondary structural features associated with wild type ECD2 (Fig. 5). Nonlinear regression analysis using the K2D2 algorithm of the CD spectrum indicated the following conformation: 23% α-helix, 24% β-sheet, and 53% coil (Table 3).
TABLE 3.
Summary of secondary structure analysis and binding constants for the ABCA4-ECD2 WT and mutant polypeptides
| Genotype | α-Helix | β-Sheet | Random coil | Tm | Kd, app |
|---|---|---|---|---|---|
| °C | m | ||||
| Wild type | 0.25 | 0.20 | 0.55 | 49.7 | 1.7 ± 1.1 × 10⁻⁷ |
| R1433H | 0.11 | 0.39 | 0.50 | NDa | ND |
| W1408L | 0.23 | 0.24 | 0.53 | 57.1 | 8.1 ± 1.9 × 10⁻⁷ |
| C1488R | 0.20 | 0.27 | 0.53 | 66.7 | 6.7 ± 1.4 × 10⁻⁷ |
a ND means not determined.
Analysis of the thermal melting of ECD2 protein demonstrated that the ellipticity measured at 220 nm increased with an increase in temperature, consistent with what would be expected to accompany protein unfolding in an α-helix to coil transition (Fig. 6A). In the temperature range of 20–80 °C, the plot for the wild type ECD2 protein fitted well to a sigmoidal curve (Fig. 6A, inset), and the Tm was 49.8 °C (Table 3). The thermal melting profile of the W1408L is shown in Fig. 6B. This mutant appeared more resistant to thermal denaturation than wtECD2, indicated by a Tm of 57.1 °C (Table 3). Therefore, CD and thermal melting experiments suggest that the wild type and mutant polypeptides have relatively similar secondary structure compositions at 25 °C, although a higher Tm may indicate a decreased structural flexibility.
C1488R Mutation
The C1488R mutation has been identified as a Stargardt disease-linked mutation in individuals of Northern and Central European ancestry (13, 23, 47). This mutation has been reported to occur in the ABCA4 gene as an individual heterozygous mutation as well as in trans with G863A mutation. This mutation represents a chemically significant substitution of a basic residue for a strictly conserved cysteine residue. The far-UV CD spectrum of the C1488R mutant at 25 °C is presented in Fig. 5. Nonlinear regression analysis of the CD spectrum using K2D2 algorithm indicated the following conformation: 20% α-helix, 27% β-sheet, and 53% coil (Table 3). Although a dramatic change in the overall CD spectrum of the protein was not observed, the substitution resulted in a significant alteration in the Tm, from 49.8 to 66.7 °C, as determined by thermal denaturation CD spectra (Fig. 6C and Table 3). The sudden increase in Tm of this mutant is not simply an indication of structural stability; rather it may signify loss of flexibility in the structure of this domain. A certain degree of structural flexibility may be important for its function. Introduction of the charged arginine residue at this location could lead to abnormal salt bridge formation.
R1443H Mutation
The R1443H mutation has been identified in individuals with Stargardt disease and appears to occur in those with Northern European as well as East Indian ancestry (23, 51). From a biochemical perspective, Arg → His represents a change from a highly basic residue to an almost neutral residue, and thus it represents a potentially significant change in terms of physicochemical properties. The CD spectrum of this mutant was significantly altered (Fig. 5). Major shifts in the CD spectral minima at 208 and 220 nm for R1443H were observed at 25 °C, consistent with a helix-coil transition concomitant with a significant change of overall secondary structure (Fig. 5). Analysis of the spectra using the K2D2 method shows that the polypeptide had relatively little α-helical content, ∼11%, as compared with 25% in wild type ECD2 (Table 3). Comparing the spectra of the native and heat-denatured states of the R1443H mutant, it appears that the heat-induced alterations of the secondary structure elements over the temperature range of 20–80 °C were small. It is likely that the absence of a sequential loss of structure with temperature may simply reflect the lack of α-helical structure of R1443H relative to wtECD2.
ECD2 Domain Specifically Interacts with All-trans-retinal
ABCA4 is believed to function primarily in the export of all-trans-retinal, produced during the visual transduction cycle, out of the rod outer segment discs (52). The ECD2 domain may have a number of different roles in the function of ABCA4. Our hypothesis is that it may play a role in the interaction of ABCA4 with retinal. In this study, we had the opportunity to study the ECD2 domain separate from the rest of the ABCA4 molecule. Therefore, we have utilized this system to examine ECD2 interaction with retinal. We observed a significant change in the tryptophan fluorescence emission spectrum of ECD2 protein upon retinal addition, and the change was dose-dependent. We have used this as a fluorescence-based assay to investigate interaction of retinal derivatives with the ECD2 domain.
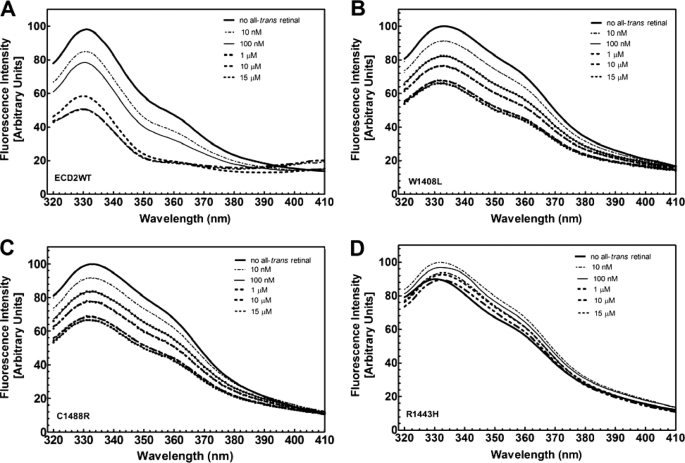
Inspection of the primary sequence of ECD2 shows that seven tryptophan residues are present in this domain (Fig. 2). These residues provide an indicator of their surroundings as their fluorescence emission is attenuated in response to a shift from hydrophobic to hydrophilic environments as a consequence of conformational change (53). Changes in protein confirmation as a result of ligand binding or amino acid substitutions can thus be monitored. The fluorescence spectra of wild type ECD2 polypeptide was collected at 25 °C as described under “Experimental Procedures” in the absence and presence of all-trans-retinal over a concentration range of 0–15 μm. ECD2 displayed an emission maximum at 335 nm, characteristic of tryptophan residues in a hydrophobic environment (Fig. 7A). Upon titration with all-trans-retinal, the tryptophan emission maxima at 335 nm decreased in a dose-dependent manner and appeared to saturate at a concentration of 10 μm retinal (Fig. 7A). A semi-log plot of the attenuated fluorescence intensities at different all-trans-retinal concentrations is shown in Fig. 8. The plot was fitted by nonlinear regression using PRISM 5.0 to sigmoidal dose response as detailed under “Experimental Procedures.” The Kd,app (or EC50) was determined to be (1.7 ± 1.1) × 10−7 m for wild type ECD2 protein.
FIGURE 7.
Tryptophan fluorescence intensity of wild type and mutant ABCA4-ECD2 polypeptides in the presence of all-trans-retinal. Fluorescence emission spectra of wild type and mutant ECD2 polypeptides were collected at 25 °C in the presence of increasing amounts of all-trans-retinal over the concentration range 0–15 μm. The concentration of ECD2 polypeptide was 0.1 mg/ml in 10 mm NaPO4 (pH 7.5), 25 mm NaCl. The scans were conducted in triplicate, and the data were analyzed as described under “Experimental Procedures.”
FIGURE 8.
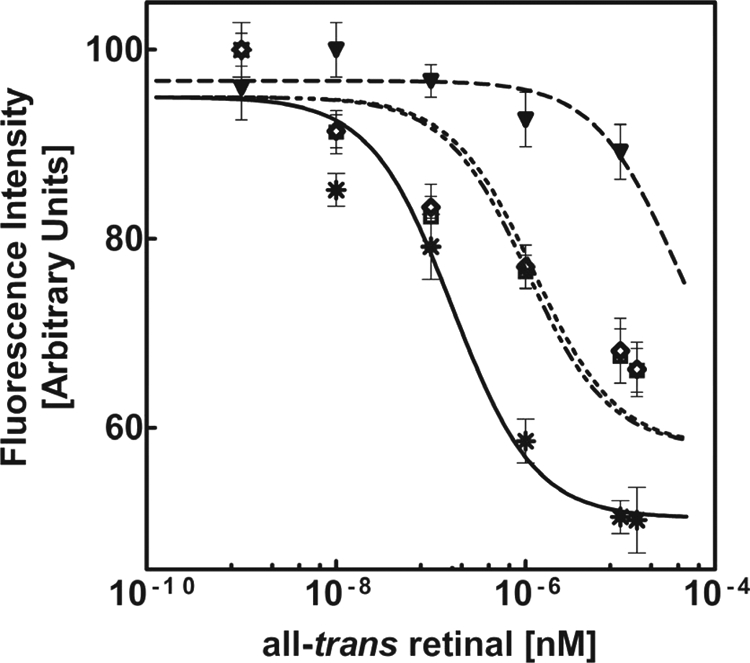
Analysis of ligand binding by monitoring changes in intrinsic tryptophan fluorescence in the presence of all-trans-retinal. Data obtained from the fluorescence emission spectra of wild type and mutant ECD2 polypeptides described in Fig. 7 were analyzed in terms of percent change in intensity versus log of the all-trans-retinal concentration.  , ECD2 WT; ▾, R1443H; □, W1408L; ◇, C1488R.
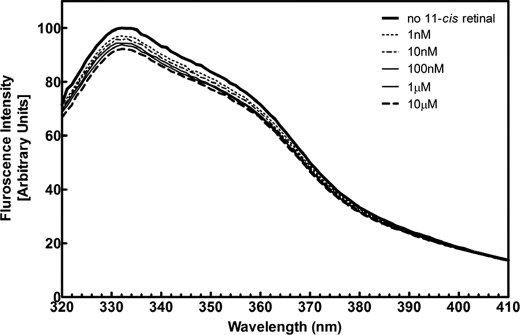
In contrast to all-trans-retinal, 11-cis-retinal had only minor effects on the tryptophan emission spectrum of ECD2 in the same concentration range (Fig. 9). Although some changes with increasing concentrations of 11-cis-retinal were observed, perturbations in the emission spectra were far less significant than that observed with all-trans-retinal. Thus, either the binding of 11-cis-retinal was far weaker than all-trans-retinal or the binding of 11-cis-retinal did not elicit the same extent of conformational changes as all-trans-retinal binding. In either case, the effects of all-trans-retinal are distinct from 11-cis-retinal.
FIGURE 9.
Tryptophan fluorescence intensity of wild type ECD2 in the presence of 11-cis-retinal. Fluorescence spectra of wild type ECD2 polypeptide were collected at 25 °C in the presence of increasing amounts of 11-cis-retinal over the concentration range 0–10 μm as indicated. The concentration of ECD2 polypeptide was 0.1 mg/ml in 10 mm NaPO4 (pH 7.5), 25 mm NaCl. The scans were conducted in triplicate, and the data were analyzed as described under “Experimental Procedures.”
Our results indicated that all-trans-retinal elicited a significant effect on the tryptophan emission spectrum of wild type ECD2 protein. Therefore, we examined its effect on the tryptophan emission spectra of the three Stargardt mutants (Fig. 7, B–D). Varying degrees of quenching of their intrinsic tryptophan fluorescence was observed in the presence of all-trans-retinal, suggesting altered modes of binding in the mutants. With both W1408L and C1488R, attenuation of tryptophan fluorescence emission was observed with increasing concentrations of all-trans-retinal (Fig. 7, B and C), albeit significantly diminished compared with that observed with the wild type ECD2 (Fig. 7A). On the other hand, mutant R1443H displayed little change in tryptophan fluorescence spectra in the presence of all-trans-retinal, which would indicate that this mutant did not undergo all-trans-retinal binding and/or associated conformational change. Quantitative analysis of all-trans-retinal binding with these three ECD2 mutants is shown in Fig. 8. The Kd,app values for W1408L and C1488R were (8.1 ± 1.9) × 10−7 and (6.7 ± 1.4) × 10−7 m, respectively. Compared with the wild type ECD2, the binding of all-trans-retinal by these mutants was significantly weaker. With R1433H mutant, the Kd,app value could not be determined.
Fluorescence Anisotropy Analysis of ECD2 Binding to All-trans-retinal
Intrinsic tryptophan fluorescence analyses in the presence of all-trans-retinal were indicative of conformational change, which in turn was suggestive of ECD2 protein-ligand interaction. Thus, it was of interest to demonstrate direct binding of all-trans-retinal to this domain. We have developed a direct all-trans-retinal binding assay using fluorescence anisotropy of all-trans-retinal. Fluorescence anisotropy is normally used for direct measurements of ligand binding by determining the concentrations of bound and free ligand in solution due to differences in anisotropy values between bound and free ligand (54–57). Therefore, true equilibrium measurements are possible in this procedure without needing to isolate the protein-ligand complex from the free ligand. Although all-trans-retinal is a relatively weak fluorophore, we examined its probable excitation and emission properties.
All-trans retinal displayed an emission spectrum between 400 and 500 nm with excitement at 310 nm (Fig. 10A). Thus, anisotropy was measured using 100 nm all-trans-retinal with the wavelengths set at 310 nm for excitation and 430 nm for emission. The plot of fluorescence anisotropy changes with ECD2 protein titration is shown in Fig. 10B. For wild type ECD2 protein, a sigmoidal semilog plot was obtained indicating equilibrium saturation binding of all-trans-retinal by this protein. Clearly, the binding of the R1433H mutant was significantly attenuated relative to that of the wild type protein, as indicated by its inability to achieve saturation. The plots, shown in Fig. 10B, were generated by nonlinear regression analysis of the data using commercial graphing software (PRISM, GraphPad Inc.). The binding parameters were determined from the fluorescence anisotropy data by equilibrium binding analysis and fitted to Equation 10. This nonlinear regression analysis gave a Kd of 4.0 ± 1.3 × 10⁻⁷ m for the wild type protein.
FIGURE 10.
Fluorescence anisotropy analysis of ECD2 proteins binding to all-trans-retinal. A, emission spectrum of 100 nm all-trans-retinal. Excitation was 310 nm and emission was scanned over a range of 370–570 nm. B, anisotropy titrations using wild type ECD2 (○) and the R1433H mutant (◇). The titrations were carried out as described under “Experimental Procedures.” Fluorescence anisotropy measurements were collected for 100 nm all-trans-retinal, and the complex was formed with ECD2 by the stepwise addition of ECD2 protein. All samples were incubated at 25 °C for 2–3 min with constant stirring before anisotropy measurement. The data were fitted to a sigmoidal binding model for all-trans-retinal binding to wild type and R1433H proteins.
DISCUSSION
The ABCA4 protein is an essential component of the visual signal transduction cycle in rod and cone cells of vertebrate retina. ABCA4 knock-out mice, as well as patients harboring mutations in ABCA4, display accumulation of all-trans-retinal and N-retinylidene-phosphatidylethanolamine in rod photoreceptor disc membranes. Retinylidene-phosphatidylethanolamine is formed by Schiff base formation due to condensation of all-trans-retinal with phosphatidylethanolamine, providing evidence that ABCA4 protein functions in the recycling of all-trans-retinal (20, 58–59). ABCA4 contains two extended extracellular loops that are evolutionarily conserved but lack any apparent function. Genetic studies involving patients with inherited macular degenerations demonstrate that mutations in these domains clearly impair ABCA4 transporter function, thereby establishing important role(s) of the ECDs (19, 23, 47–48, 51).
Second Extracellular Domain of ABCA4 Possesses a Highly Ordered and Stable Conformation
To delineate its role in ABCA4 transporter function, we first explored the structure and conformational features of the ECD2 domain and alterations due to disease-associated mutations. Analysis of the CD spectral data using the K2D2 method indicated that the wild type polypeptide possessed a highly ordered structure that has a reasonably high α-helical content in addition to β-sheet and extended structures. Depending on the mutation, ECD2 protein conformation changed only slightly or very drastically. Thus, CD analysis provided a method for monitoring conformational changes due to macular degenerative disease-associated mutations. However, despite an intensive search of the literature, very little collective information correlating the severity and age of onset with a given mutation is available, making it difficult for us to rigorously correlate the observed structural defects with a given clinical phenotype.
Influence of Stargardt Disease-associated Mutations on ECD2 Domain Secondary Structure
Of the three mutants examined here, the R1443H mutation appeared to be the most severe in terms of its influence on the secondary structure of ECD2. As a consequence of this mutation, the ECD2 polypeptide appeared to lose the majority of its α-helical secondary structure (Fig. 5). Very little change was observed in the protein structure in response to temperature (Fig. 6D), suggesting that the polypeptide was highly disordered. A minimal change in the CD spectrum was observed with the W1408L mutation. This mutant appeared to have secondary structural parameters that were comparable with that of the wild type ECD2 polypeptide. In addition, only a small increase in Tm was observed from the thermal melting curves. This small increase may be due to the decrease in relative hydrophobicity associated with the Trp → Leu mutation, such as that described by Kotik and Zuber (60) in their studies examining the role of tryptophan residues in the structural and thermal stability of lactate dehydrogenase. The C1488R mutation appeared to be intermediate in nature with respect to its influence on the ECD2 structure. Based on the CD analysis of the protein, it appeared to have lower α-helix content. Interestingly, a major increase in the Tm obtained from the thermal melting profile of the CD spectra was observed. The substitution of a charged residue, arginine for cysteine, may provide enhanced thermal stability to the structure, perhaps through ionic interactions. Liao et al. (61) report similar increases in Tm upon introduction of charged residues into porcine αβ-crystallin.
ECD2 Domain Interacts Specifically with All-trans-retinal
Several lines of investigation support the hypothesis that all-trans-retinal, the product of the visual transduction cycle, is the substrate of ABCA4 (62–64). Physiologically, studies of ABCA4 knock-out mice show elevated levels of all-trans-retinal and the protonated Schiff base, N-retinylidene-phosphatidylethanolamine, as well as the di-retinal pyridinium compound A2E in the retinal pigment epithelium (64–66). Together, these studies strongly support all-trans-retinal as the substrate for ABCA4. At present, however, no assay for ATP-dependent transport by ABCA4 has been developed and which region of the ABCA4 molecule interacts specifically with the substrate remains to be identified.
Using tryptophan fluorescence emission spectroscopy, we have investigated the binding of ECD2 domain to retinal, and we examined how this binding is affected in disease-associated mutants. When all-trans-retinal was added to the ECD2 polypeptide, dose-dependent attenuation of its tryptophan fluorescence was observed (Fig. 7). Titration with all-trans-retinal was used to evaluate the binding quantitatively, and the ECD2 polypeptide bound all-trans-retinal with reasonably high affinity, Kd,app of (1.7 ± 1.1) × 10−7 m (Fig. 8 and Table 3). The binding appeared highly specific as attenuation of tryptophan fluorescence by 11-cis-retinal was significantly lower (Fig. 9). Using fluorescence anisotropy, we were able to demonstrate direct interaction of the ECD2 polypeptide and quantitate its interaction. The Kd of (4 ± 1.3) × 10−7 m is ∼2-fold higher than that derived from the intrinsic tryptophan fluorescence. This small difference may be attributed to the fact that the two approaches are assessing retinal interaction through the measurement of two different parameters; one examines the change in ECD2 protein structure using tryptophan environment as a reporter, and the other approach measures the fluorescence anisotropy of all-trans-retinal itself. The affinity of interaction for all-trans-retinal observed in our experimental systems is ∼10-fold higher than that previously reported by Beharry et al. (63).
The locations of the seven tryptophan residues are indicated on the multiple sequence alignment shown in Fig. 2. These residues are strictly conserved and are distributed across the domain. The emission maxima and quantum yields of tryptophan residues vary widely between proteins and can be a function of protein structure as well as tryptophan environment (37, 67–68). A given protein conformation may contribute to specific protein environments that quench a given tryptophan residue or residues. Gryczynski et al. (69) demonstrated that hydrogen bonds in hydrophilic solvents modulate tryptophan emission at 340 nm significantly. If the indole group of tryptophan moves from the hydrogen-bonded hydrophilic environment to a totally nonpolar environment, the quantum yield at 340 nm will be quenched in an amount ≥90%. All-trans-retinal is a relatively large hydrophobic molecule, and its binding site would need to be hydrophobic as well. If one assumes that four out of the six strictly conserved tryptophans are involved in a conformational change that leads to the formation of a hydrophobic binding pocket, then a large quenching, such as that observed here, is possible. Indeed, studies examining the retinoid binding properties of the nematode ABA-1 allergen protein describe the major structural role of tryptophan in providing a hydrophobic binding site for the ligand (70). Therefore, a possible explanation for the observed decrease in fluorescence would be that the ECD2 domain undergoes a conformational change during retinal binding to create a hydrophobic pocket. The conformational change causes a change in the environment of the tryptophan residues, thereby leading to the observed decrease in fluorescence. In addition, based on our excitation/emission profile of all-trans-retinal (Fig. 10A), fluorescence resonance energy transfer from tryptophan to all-trans-retinal cannot be ruled out.
Influence of Stargardt Disease-associated Mutations on ECD2 Interaction with All-trans-retinal
To date, the biochemical properties measured for mutant ABCA4 proteins have been restricted to ATP binding and hydrolysis, protein localization of heterologously expressed protein in cell culture, and interaction of the nucleotide binding domains (31, 32, 66, 71–73). All mutants investigated in this study demonstrated decreases in their affinity of interaction with all-trans-retinal, based on their ability to attenuate intrinsic tryptophan fluorescence (Figs. 7 and 8). In the case of mutant R1443H, a large decrease in the binding affinity was observed, with a >250-fold increase in Kd (Fig. 8 and Table 3). Less dramatic changes were seen with the other mutants investigated in this study, with a 5–8-fold increase in Kd for W1408L and C1488R, respectively. With mutant R1443H, the apparent lack of interaction with all-trans-retinal was observed. Direct analysis of mutant R1433H interaction confirmed impairment of all-trans-retinal binding by this mutant, as shown by the inability to achieve saturation (Fig. 10B). Interestingly, the functional alterations in all-trans-retinal interaction were mirrored by the structural alterations in this domain as determined by CD spectroscopic analysis of their conformations. The conformation of R1443H was strikingly different from that of wtECD2 and appeared refractory to changes in temperature. It is likely that its inability to interact with all-trans-retinal has a basis in its abnormal structural features. Likewise, the relatively moderate structural changes of W1408L and C1488R also correlated with more moderate changes in interaction with all-trans-retinal as compared with the wild type ECD2.
In summary, our studies demonstrate that the ECD2 domain of ABCA4 has a highly ordered and stable secondary structure, which appears to undergo conformational change in response to its specific interaction with its putative substrate all-trans-retinal. Disease-associated mutations in this domain were observed to influence the secondary structure and all-trans-retinal binding affinity. Further studies of each of the ABCA4 domains are required to fully elucidate the mechanism of retinal transport by this complex and physiologically important ABC transporter.
Acknowledgments
We thank Drs. Richard Lewis (Baylor College of Medicine, Houston, TX) and Rando Allikmets (Columbia University, New York) for additional insights regarding the clinical phenotypes of patients harboring ABCA4 mutations, and Dr. Robert Molday (University of British Columbia, Canada) for helpful discussions. We are also grateful to Dr. S. Greening (Thomas Jefferson University) for editorial review of the manuscript.
This work was supported, in whole or in part, by National Institutes of Health Grant EY 013113 from NEI and an administrative supplement, Quantitative Physical Measurements at the Nanoscale (to E. E. B.-F.) and AI064974 (to S. B. B.).
- ABC
- ATP-binding cassette
- TMD
- transmembrane domain
- ECD
- extracellular domain
- NBD
- nucleotide binding domain
- ATR
- all-trans-retinal.
REFERENCES
- 1.Higgins C. F. (1992) Annu. Rev. Cell Biol. 8, 67–113 [DOI] [PubMed] [Google Scholar]
- 2.Higgins C. F. (2001) Res. Microbiol. 152, 205–210 [DOI] [PubMed] [Google Scholar]
- 3.Higgins C. F., Linton K. J. (2001) Science 293, 1782–1784 [DOI] [PubMed] [Google Scholar]
- 4.Hettema E. H., van Roermund C. W., Distel B., van den Berg M., Vilela C., Rodrigues-Pousada C., Wanders R. J., Tabak H. F. (1996) EMBO J. 15, 3813–3822 [PMC free article] [PubMed] [Google Scholar]
- 5.Ewart G. D., Cannell D., Cox G. B., Howells A. J. (1994) J. Biol. Chem. 269, 10370–10377 [PubMed] [Google Scholar]
- 6.Ewart G. D., Howells A. J. (1998) Methods Enzymol. 292, 213–224 [DOI] [PubMed] [Google Scholar]
- 7.Berkower C., Michaelis S. (1991) EMBO J. 10, 3777–3785 [DOI] [PMC free article] [PubMed] [Google Scholar]
- 8.Walker J. E., Saraste M., Runswick M. J., Gay N. J. (1982) EMBO J. 1, 945–951 [DOI] [PMC free article] [PubMed] [Google Scholar]
- 9.Dean M., Rzhetsky A., Allikmets R. (2001) Genome Res. 11, 1156–1166 [DOI] [PubMed] [Google Scholar]
- 10.Illing M., Molday L. L., Molday R. S. (1997) J. Biol. Chem. 272, 10303–10310 [DOI] [PubMed] [Google Scholar]
- 11.Papermaster D. S., Schneider B. G., Zorn M. A., Kraehenbuhl J. P. (1978) J. Cell Biol. 78, 415–425 [DOI] [PMC free article] [PubMed] [Google Scholar]
- 12.Allikmets R. (2000) Am. J. Hum. Genet. 67, 487–491 [DOI] [PMC free article] [PubMed] [Google Scholar]
- 13.Briggs C. E., Rucinski D., Rosenfeld P. J., Hirose T., Berson E. L., Dryja T. P. (2001) Invest. Ophthalmol. Vis. Sci. 42, 2229–2236 [PubMed] [Google Scholar]
- 14.Klevering B. J., Blankenagel A., Maugeri A., Cremers F. P., Hoyng C. B., Rohrschneider K. (2002) Invest. Ophthalmol. Vis. Sci. 43, 1980–1985 [PubMed] [Google Scholar]
- 15.Klevering B. J., Deutman A. F., Maugeri A., Cremers F. P., Hoyng C. B. (2005) Graefes Arch. Clin. Exp. Ophthalmol. 243, 90–100 [DOI] [PubMed] [Google Scholar]
- 16.Zhang K., Kniazeva M., Hutchinson A., Han M., Dean M., Allikmets R. (1999) Genomics 60, 234–237 [DOI] [PubMed] [Google Scholar]
- 17.Allikmets R., Singh N., Sun H., Shroyer N. F., Hutchinson A., Chidambaram A., Gerrard B., Baird L., Stauffer D., Peiffer A., Rattner A., Smallwood P., Li Y., Anderson K. L., Lewis R. A., Nathans J., Leppert M., Dean M., Lupski J. R. (1997) Nat. Genet. 15, 236–246 [DOI] [PubMed] [Google Scholar]
- 18.Arnell H., Mäntyjärvi M., Tuppurainen K., Andréasson S., Dahl N. (1998) Acta Ophthalmol. Scand. 76, 649–652 [DOI] [PubMed] [Google Scholar]
- 19.Fishman G. A., Stone E. M., Grover S., Derlacki D. J., Haines H. L., Hockey R. R. (1999) Arch. Ophthalmol. 117, 504–510 [DOI] [PubMed] [Google Scholar]
- 20.Molday R. S. (2007) J. Bioenerg. Biomembr. 39, 507–517 [DOI] [PubMed] [Google Scholar]
- 21.Bennett J. (2009) N. Engl. J. Med. 361, 2483–2484 [DOI] [PubMed] [Google Scholar]
- 22.Simonelli F., Maguire A. M., Testa F., Pierce E. A., Mingozzi F., Bennicelli J. L., Rossi S., Marshall K., Banfi S., Surace E. M., Sun J., Redmond T. M., Zhu X., Shindler K. S., Ying G. S., Ziviello C., Acerra C., Wright J. F., McDonnell J. W., High K. A., Bennett J., Auricchio A. (2010) Mol. Ther. 18, 643–650 [DOI] [PMC free article] [PubMed] [Google Scholar]
- 23.Jaakson K., Zernant J., Külm M., Hutchinson A., Tonisson N., Glavac D., Ravnik-Glavac M., Hawlina M., Meltzer M. R., Caruso R. C., Testa F., Maugeri A., Hoyng C. B., Gouras P., Simonelli F., Lewis R. A., Lupski J. R., Cremers F. P., Allikmets R. (2003) Hum. Mutat. 22, 395–403 [DOI] [PubMed] [Google Scholar]
- 24.Bungert S., Molday L. L., Molday R. S. (2001) J. Biol. Chem. 276, 23539–23546 [DOI] [PubMed] [Google Scholar]
- 25.Yatsenko A. N., Wiszniewski W., Zaremba C. M., Jamrich M., Lupski J. R. (2005) J. Mol. Evol. 60, 72–80 [DOI] [PubMed] [Google Scholar]
- 26.Chen W., Bahl O. P. (1993) Mol. Cell. Endocrinol. 91, 35–41 [DOI] [PubMed] [Google Scholar]
- 27.Zhang G., Xi J., Wang X., Guo J., Zhang H., Yang Y., Qiao S., Wang L., Zhang H., He L., Zhu Y. (2008) J. Immunol. Methods 334, 21–28 [DOI] [PubMed] [Google Scholar]
- 28.Ling V. (1997) Cancer Chemother. Pharmacol. 40, S3–S8 [DOI] [PubMed] [Google Scholar]
- 29.Duffieux F., Annereau J. P., Boucher J., Miclet E., Pamlard O., Schneider M., Stoven V., Lallemand J. Y. (2000) Eur. J. Biochem. 267, 5306–5312 [DOI] [PubMed] [Google Scholar]
- 30.Biswas E. E. (2001) Biochemistry 40, 8181–8187 [DOI] [PubMed] [Google Scholar]
- 31.Biswas-Fiss E. E. (2003) Biochemistry 42, 10683–10696 [DOI] [PubMed] [Google Scholar]
- 32.Suárez T., Biswas S. B., Biswas E. E. (2002) J. Biol. Chem. 277, 21759–21767 [DOI] [PubMed] [Google Scholar]
- 33.Massiah M. A., Ko Y. H., Pederson P. L., Mildvan A. S. (1999) Biochemistry 38, 7453–7461 [DOI] [PubMed] [Google Scholar]
- 34.Sheppard D. N., Welsh M. J. (1999) Physiol. Rev. 79, S23–S45 [DOI] [PubMed] [Google Scholar]
- 35.Kreimer D. I., Malak H., Lakowicz J. R., Trakhanov S., Villar E., Shnyrov V. L. (2000) Eur. J. Biochem. 267, 4242–4252 [DOI] [PubMed] [Google Scholar]
- 36.Sambrook J., Fritsch E. F., Maniatis T. (1989) Molecular Cloning: A Laboratory Manual, p. 391, Cold Spring Harbor Laboratory Press, Cold Spring Harbor, NY [Google Scholar]
- 37.Winterfeld S., Imhof N., Roos T., Bär G., Kuhn A., Gerken U. (2009) Biochemistry 48, 6684–6691 [DOI] [PubMed] [Google Scholar]
- 38.Booth C. L., Pulaski L., Gottesman M. M., Pastan I. (2000) Biochemistry 39, 5518–5526 [DOI] [PubMed] [Google Scholar]
- 39.Balan A., Ferreira R. C., Ferreira L. C. (2008) Genet. Mol. Res. 7, 117–126 [DOI] [PubMed] [Google Scholar]
- 40.Brunkhorst C., Wehmeier U. F., Piepersberg W., Schneider E. (2005) Res. Microbiol. 156, 322–327 [DOI] [PubMed] [Google Scholar]
- 41.Mace P. D., Cutfield J. F., Cutfield S. M. (2007) Protein Expr. Purif. 52, 40–49 [DOI] [PubMed] [Google Scholar]
- 42.Perez-Iratxeta C., Andrade-Navarro M. A. (2008) BMC Struct. Biol. 8, 25. [DOI] [PMC free article] [PubMed] [Google Scholar]
- 43.Andrade M. A., Chacón P., Merelo J. J., Morán F. (1993) Protein Eng. 6, 383–390 [DOI] [PubMed] [Google Scholar]
- 44.Bradford M. M. (1976) Anal. Biochem. 72, 248–254 [DOI] [PubMed] [Google Scholar]
- 45.Laemmli U. K. (1970) Nature 227, 680–685 [DOI] [PubMed] [Google Scholar]
- 46.Kyte J., Doolittle R. F. (1982) J. Mol. Biol. 157, 105–132 [DOI] [PubMed] [Google Scholar]
- 47.Lewis R. A., Shroyer N. F., Singh N., Allikmets R., Hutchinson A., Li Y., Lupski J. R., Leppert M., Dean M. (1999) Am. J. Hum. Genet. 64, 422–434 [DOI] [PMC free article] [PubMed] [Google Scholar]
- 48.Webster A. R., Héon E., Lotery A. J., Vandenburgh K., Casavant T. L., Oh K. T., Beck G., Fishman G. A., Lam B. L., Levin A., Heckenlively J. R., Jacobson S. G., Weleber R. G., Sheffield V. C., Stone E. M. (2001) Invest. Ophthalmol. Vis. Sci. 42, 1179–1189 [PubMed] [Google Scholar]
- 49.Fishman G. A., Stone E. M., Eilason D. A., Taylor C. M., Lindeman M., Derlacki D. J. (2003) Arch. Ophthalmol. 121, 851–855 [DOI] [PubMed] [Google Scholar]
- 50.Samanta U., Chakrabarti P. (2001) Protein Eng. 14, 7–15 [DOI] [PubMed] [Google Scholar]
- 51.September A. V., Vorster A. A., Ramesar R. S., Greenberg L. J. (2004) Invest. Ophthalmol. Vis. Sci. 45, 1705–1711 [DOI] [PubMed] [Google Scholar]
- 52.Molday R. S., Zhong M., Quazi F. (2009) Biochim. Biophys. Acta 1791, 573–583 [DOI] [PMC free article] [PubMed] [Google Scholar]
- 53.Lakowicz J. R. (1999) Principals of Fluorescence Spectroscopy, 2nd Ed., pp. 449–451, Kluwer Academic/ Plenum Publishing Corp., New York [Google Scholar]
- 54.Boyer M., Poujol N., Margeat E., Royer C. A. (2000) Nucleic Acids Res. 28, 2494–2502 [DOI] [PMC free article] [PubMed] [Google Scholar]
- 55.Nahoum V., Pérez E., Germain P., Rodríguez-Barrios F., Manzo F., Kammerer S., Lemaire G., Hirsch O., Royer C. A., Gronemeyer H., de Lera A. R., Bourguet W. (2007) Proc. Natl. Acad. Sci. U.S.A. 104, 17323–17328 [DOI] [PMC free article] [PubMed] [Google Scholar]
- 56.Ozers M. S., Hill J. J., Ervin K., Wood J. R., Nardulli A. M., Royer C. A., Gorski J. (1997) J. Biol. Chem. 272, 30405–30411 [DOI] [PubMed] [Google Scholar]
- 57.Pogenberg V., Guichou J. F., Vivat-Hannah V., Kammerer S., Pérez E., Germain P., de Lera A. R., Gronemeyer H., Royer C. A., Bourguet W. (2005) J. Biol. Chem. 280, 1625–1633 [DOI] [PubMed] [Google Scholar]
- 58.Saari J. C. (2000) Invest. Ophthalmol. Vis. Sci. 41, 337–348 [PubMed] [Google Scholar]
- 59.Lamb T. D., Pugh E. N., Jr. (2006) Invest. Ophthalmol. Vis. Sci. 47, 5137–5152 [DOI] [PubMed] [Google Scholar]
- 60.Kotik M., Zuber H. (1993) Eur. J. Biochem. 211, 267–280 [DOI] [PubMed] [Google Scholar]
- 61.Liao J. H., Lee J. S., Wu S. H., Chiou S. H. (2009) Mol. Vis. 15, 1429–1444 [PMC free article] [PubMed] [Google Scholar]
- 62.Ahn J., Molday R. S. (2000) Methods Enzymol. 315, 864–879 [DOI] [PubMed] [Google Scholar]
- 63.Beharry S., Zhong M., Molday R. S. (2004) J. Biol. Chem. 279, 53972–53979 [DOI] [PubMed] [Google Scholar]
- 64.Weng J., Mata N. L., Azarian S. M., Tzekov R. T., Birch D. G., Travis G. H. (1999) Cell 98, 13–23 [DOI] [PubMed] [Google Scholar]
- 65.Radu R. A., Mata N. L., Bagla A., Travis G. H. (2004) Proc. Natl. Acad. Sci. U.S.A. 101, 5928–5933 [DOI] [PMC free article] [PubMed] [Google Scholar]
- 66.Sun H., Molday R. S., Nathans J. (1999) J. Biol. Chem. 274, 8269–8281 [DOI] [PubMed] [Google Scholar]
- 67.Lakowicz J. R. (2006) Principals of Fluorescence Spectroscopy, 3rd Ed., pp. 533–534, Springer Science, New York [Google Scholar]
- 68.Lugo M. R., Sharom F. J. (2009) Arch. Biochem. Biophys 492, 17–28 [DOI] [PubMed] [Google Scholar]
- 69.Gryczynski I., Wiczk W., Johnson M. L., Lakowicz J. R. (1988) Biophys. Chem. 32, 173–185 [DOI] [PubMed] [Google Scholar]
- 70.Kennedy M. W., Brass A., McCruden A. B., Price N. C., Kelly S. M., Cooper A. (1995) Biochemistry 34, 6700–6710 [DOI] [PubMed] [Google Scholar]
- 71.Ahn J., Wong J. T., Molday R. S. (2000) J. Biol. Chem. 275, 20399–20405 [DOI] [PubMed] [Google Scholar]
- 72.Biswas-Fiss E. E. (2006) Biochemistry 45, 3813–3823 [DOI] [PubMed] [Google Scholar]
- 73.Shroyer N. F., Lewis R. A., Yatsenko A. N., Wensel T. G., Lupski J. R. (2001) Hum. Mol. Genet. 10, 2671–2678 [DOI] [PubMed] [Google Scholar]


