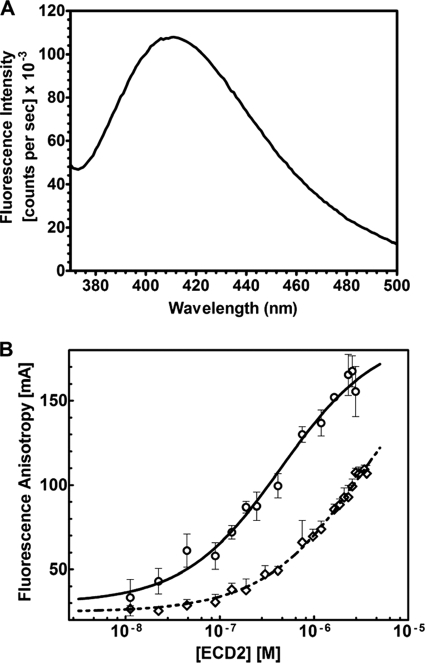
FIGURE 10.
Fluorescence anisotropy analysis of ECD2 proteins binding to all-trans-retinal. A, emission spectrum of 100 nm all-trans-retinal. Excitation was 310 nm and emission was scanned over a range of 370–570 nm. B, anisotropy titrations using wild type ECD2 (○) and the R1433H mutant (◇). The titrations were carried out as described under “Experimental Procedures.” Fluorescence anisotropy measurements were collected for 100 nm all-trans-retinal, and the complex was formed with ECD2 by the stepwise addition of ECD2 protein. All samples were incubated at 25 °C for 2–3 min with constant stirring before anisotropy measurement. The data were fitted to a sigmoidal binding model for all-trans-retinal binding to wild type and R1433H proteins.

