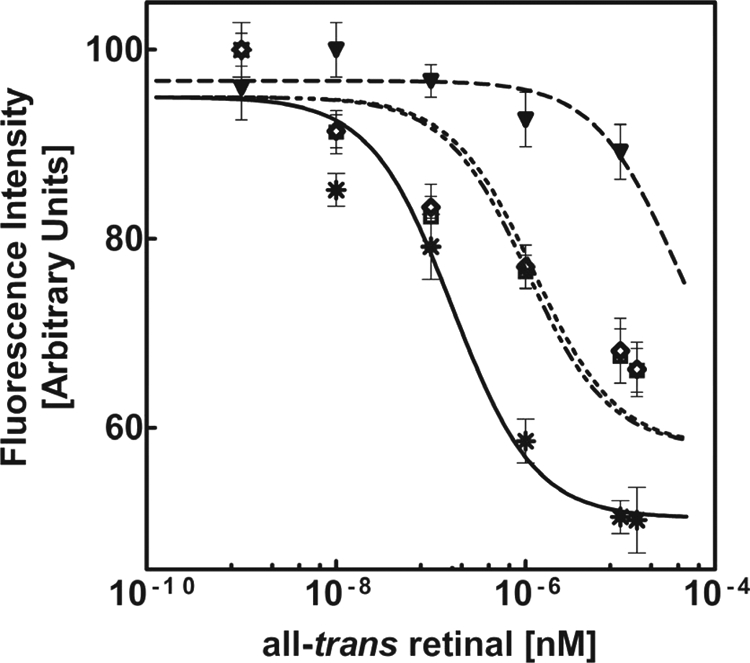
FIGURE 8.

Analysis of ligand binding by monitoring changes in intrinsic tryptophan fluorescence in the presence of all-trans-retinal. Data obtained from the fluorescence emission spectra of wild type and mutant ECD2 polypeptides described in Fig. 7 were analyzed in terms of percent change in intensity versus log of the all-trans-retinal concentration.  , ECD2 WT; ▾, R1443H; □, W1408L; ◇, C1488R.
