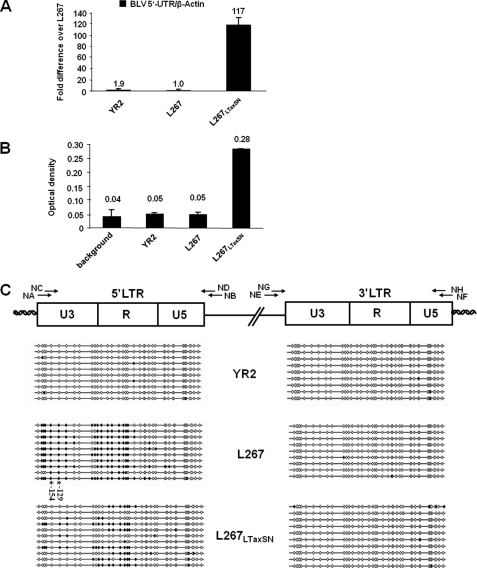
FIGURE 2.
CpG methylation status in the 5′ and 3′-LTR regions of BLV proviruses integrated in different infected cell lines. A, mRNA expression levels in the BLV-infected YR2, L267, and L267LTaxSN cell lines. Total RNA samples were extracted and digested by DNase I. First strand cDNA was synthesized by reverse transcription, and quantitative PCR was performed with oligonucleotide primers amplifying the 5′-UTR region of BLV or the β-actin gene. Results are presented as the ratio of 5′-UTR to β-actin and are the mean values of triplicate samples. The results from a representative experiment of three independent experiments are shown. B, ex vivo expression of BLV in infected YR2, L267, and L267LTaxSN cell lines. The BLV p24 major gag antigen levels were titrated in the culture supernatants by ELISA. Data are the mean values of triplicate samples. The results from a representative experiment of three independent ELISA experiments are shown. C, bisulfite sequencing analysis of the CpG methylation status in the 5′- and 3′-LTRs of the YR2, L267, and L267LTaxSN cell lines. Genomic DNA from the three cell lines was extracted and treated by sodium bisulfite/hydroquinone. The two LTRs were amplified by nested PCR, amplified PCR products were subcloned in a TA cloning vector, and 10–11 clones were sequenced for each cell line. The methylation status of these clones is presented for each cell line. The positions and orientations of PCR primers (NA, NB, NC, ND, NE, NF, NG, and NH) used to amplify bisulfite-treated BLV DNA by nested PCR are indicated by arrows. Open circles represent unmethylated CpG dinucleotides, and filled circles represent methylated CpG dinucleotides. The −154 CpG and −129 CpG (located within the CRE1 and CRE2 sites, respectively) are hypermethylated in the L267 cell line and are indicated by asterisks.

