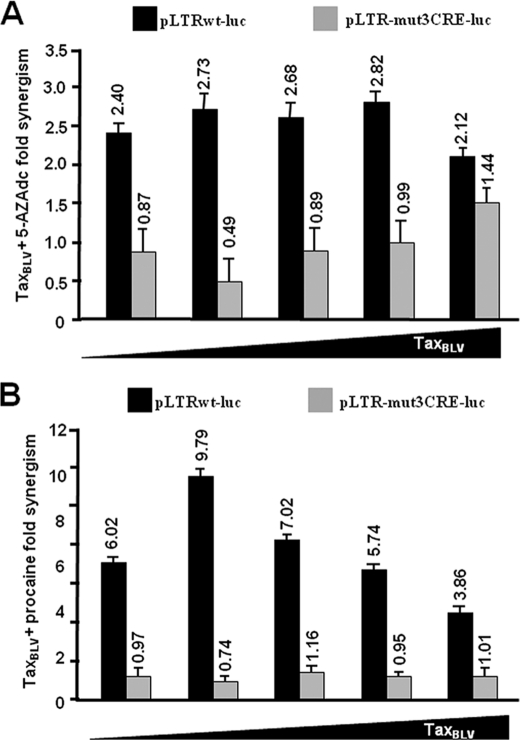
FIGURE 4.
-Fold activation of the BLV promoter activity by TaxBLV and inhibitors of DNMTs. The histograms represent -fold inductions of BLV promoter activity by TaxBLV and 5-AZAdc (A) or procaine (B) as detailed in Table 1. Values represent the means of triplicate samples ± S.E. are indicated. An experiment representative of four independent transfections is shown.

