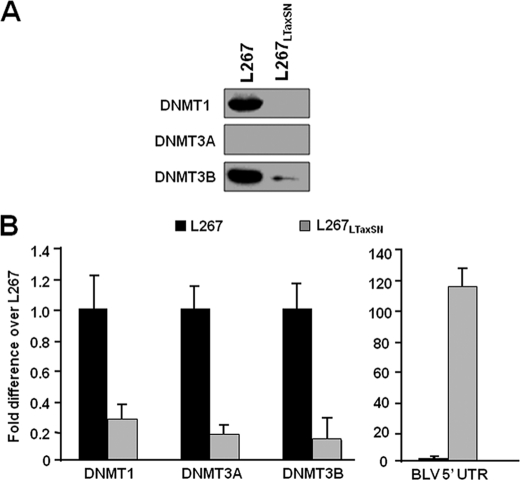
FIGURE 8.
Down-regulation of DNMT expression levels by TaxBLV. A, nuclear extracts from the two BLV-infected cell lines, L267 and L267LTaxSN, were analyzed by Western blotting with an antibody directed against DNMT1, DNMT3B, or DNMT3A. We could not assess the protein level of DNMT3A because no ovine antibody against DNMT3A was available commercially, and the murine anti-DNMT3A antibody did not reveal any specific band in either the L267 or the L267LTaxSN cellular extracts. B, total RNA samples were extracted from L267 or L267LTaxSN cells and digested by DNase I. First strand cDNA was synthesized by reverse transcription, and qPCR reactions were performed with oligonucleotide primers amplifying DNMT1, DNMT3A, or DNMT3B transcripts and β-actin transcripts. The results are presented as the ratio of DNMT to β-actin. Means ± S.E. from triplicate samples are represented. An experiment representative of three independent experiments is shown. As a control, we performed quantitative PCR with oligonucleotide primers amplifying the 5′-UTR region of the BLV as presented in Fig. 2A.

