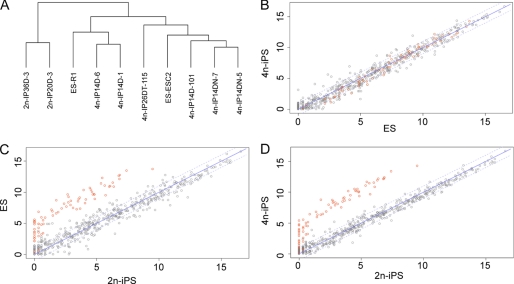
FIGURE 1.
miRNA expression patterns distinguish 2n-iPS cell lines from ES and 4n-iPS cell lines. A, clustering analysis of miRNA read counts in the 10 studied cell lines. B, scatter plot of miRNA expression in ES and 4n-iPS cell lines. C, scatter plot of miRNA expression in ES and 2n-iPS cell lines. D, scatter plot of miRNA expression in 4n-iPS and 2n-iPS cell lines. Normalized read counts (reads per million) were averaged within each cell line group (ES, 4n-iPS, and 2n-iPS) and log 2-transformed prior to drawing the plot.

