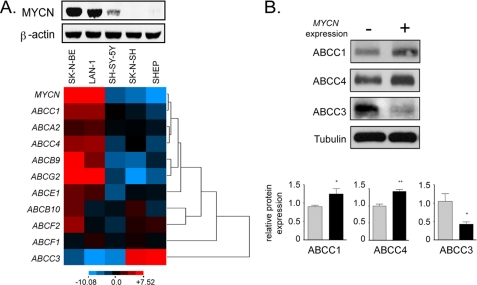
FIGURE 5.
Correlation of MYCN and ABC transporter gene expression in neuroblastoma cell lines. A, MYCN expression was evaluated in five different neuroblastoma cell line (upper panel). ABC gene expression was determined by RQ-PCR and data were clustered as described for Fig. 2 (lower panel). B, ABCC protein expression in cells overexpressing MYCN. MYCN gene expression was suppressed in TET21/N cells by the addition of 2 μg/ml tetracycline for at least 48 h (−) or induced by the removal of tetracycline (+). ABCC protein expression was measured by Western blotting of whole cell lysates (ABCC1 and ABCC4) or membrane preparations (ABCC3). Protein loading was normalized by tubulin Western blot (whole cell lysates) or by Ponceau staining (membrane preparations, not shown). Relative expression in triplicate samples was quantified using densitometry. *, p < 0.05; **, p < 0.005.

