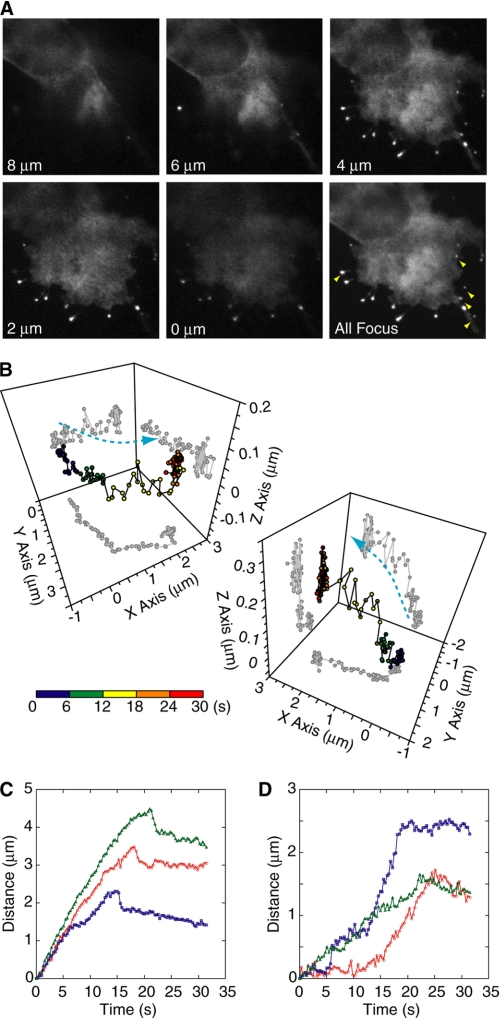
FIGURE 6.
Elongation of unattached filopodial tips using three-dimensional tracking technique. A, confocal images of GFP-M10-FULL-overexpressed cells at distinct focal planes. The lower right panel shows a projection of images collected from nine different focal planes. The glass surface was set to be at a 2-μm position. Yellow arrowheads indicate the unattached filopodia. B, typical traces of three-dimensional tracking of tips from attached (left) or unattached (right) filopodia. The color bar indicates the running time. C and D, three typical traces of the tip positions from initiation to retraction of attached (C) or unattached (D) filopodia in overexpressed GFP-M10-FULL. The distance was defined as the distance from the initiating position to the most distant point of the fluorescence spot to avoid the effect of filopodia swinging motion.

