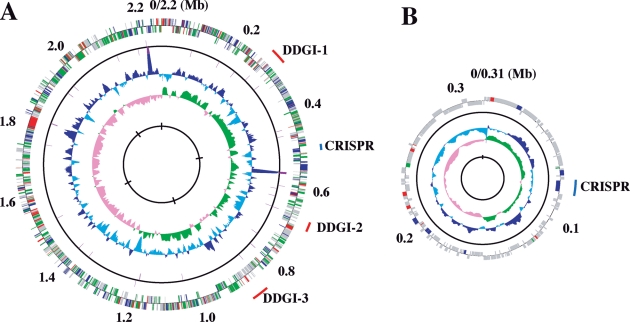
Figure 1.
Circular representation of the D. desulfuricans SSM1 genome. (A) Chromosome. (B) Megaplasmid pDF308. From the inside, the first and second circles show the GC skew (values greater than or less than zero are indicated in green and pink, respectively) and the G + C percent content (values greater or smaller than the average percentage in the overall chromosome or plasmid are shown in blue and sky blue, respectively) in a 10-kb window with 100-bp step, respectively. The third and fourth circles show the presence of RNAs (rRNA, tRNA, and small RNA genes); CDSs aligned in the clockwise and counterclockwise directions are indicated in the upper and lower sides of the circle, respectively. Different colours indicate different functional categories: red for information storage and processing; green for metabolism; blue for cellular processes and signalling; grey for poorly characterized function; and purple for RNA genes. The outermost circle shows the location of genomic islands (red) and CRISPR/Cas systems (blue). The ‘0’ marked on the outmost circles corresponds to the putative replication origin, and the putative replication termination site of the chromosome is at 1.23 Mb.

