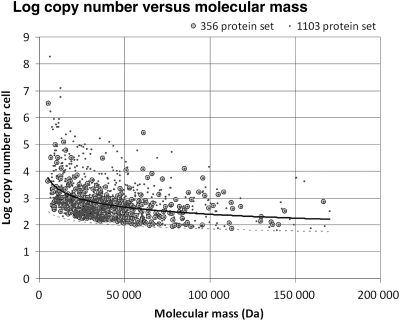
Figure 3.
Distribution of emPAI-estimated log protein abundance versus molecular mass for the 1103 proteins reported by Ishihama et al.22 and the subset used in this study (359 proteins, see Materials and methods). The overall shape of the distribution is in broad agreement with the log protein abundance versus length plot reported in Fig. S7 of Ishihama et al. The correlation coefficients under a power-law distribution are: r = −0.429***, ρ = −0.381*** for the 1103 protein set and r = −0.429***, ρ = −0.394*** for the 359 protein set. The Pearson correlation coefficients under a linear distribution are r = −0.318*** and r = −0.304***, respectively. For the 359 protein subset, the correlation between molecular mass and gene length is very strong (r = 0.999***, ρ = 0.999***). The dotted line underscores the length-dependent bias in the method's lower detection limit.

