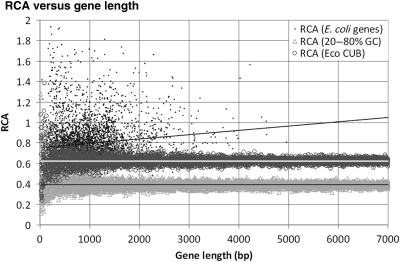
Figure 4.
Distribution of RCA values versus length for the 4029 E. coli genes in the M3D-derived expression data set, 5000 randomly generated sequences of random length (6–6999 bp) with random %GC content in the 20 − 80% range and 5000 randomly generated sequences of random length (6–6999 bp) following the E. coli CUB. Correlation coefficients are as follows: E. coli genes (r = 0.122***, ρ = 0.173***), E. coli CUB random sequence (r = −0.0138, ρ = 0.005) and 20–80% GC random sequence (r = 0.012, ρ = 0.025).

