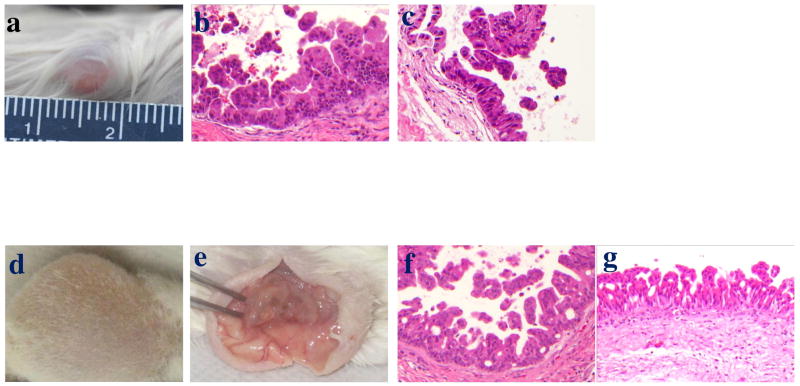
Figure 4.
IPMN-1 re-implantation. The tumor in NOG mouse approximately 12 weeks after injection with 20 million IPMN-1T cells (a). Histology of the reimplanted tumor (20X) showing a region without invasion (b, c). The third passage tumor in NOG mouse in 12 weeks after injection (d). Tumor shown in (d) after opening the skin and bisecting the tumor, revealing the nodular features of the tumor (e). Histology of the third passage tumor (20X), without evidence of invasion (f, g).

