
Figure 3. ISG, IRF and IFN genes are induced in a dsRNA length-dependent fashion.
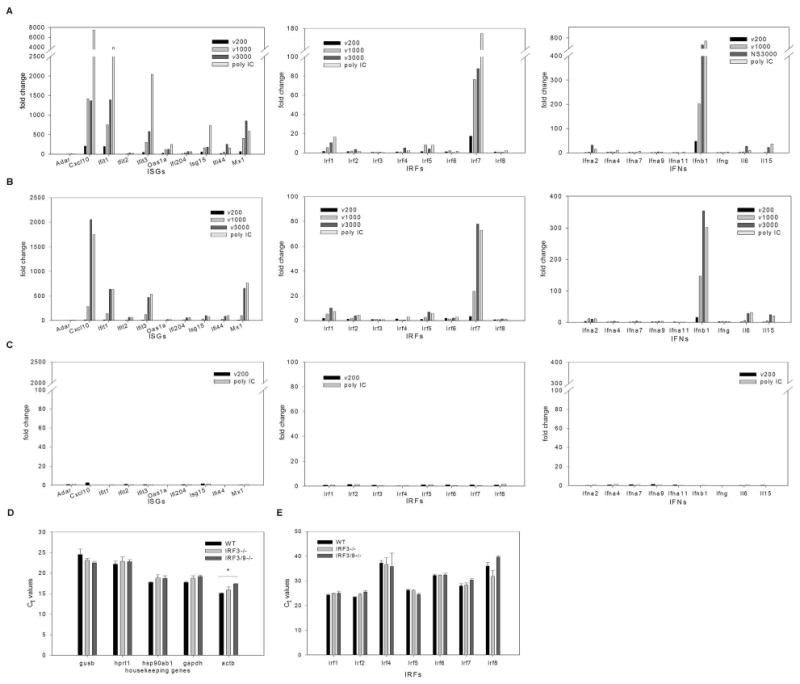
A, WT, B, IRF3-/- and C, IRF3&9-/- MEFs were treated with in vitro transcribed dsRNA of different lengths (ν200, ν1000, ν3000) or poly IC using concentrations shown to induce a maximal antiviral response (1.5nM, 3nM and 8.5 nM dsRNA for WT, IRF3-/- and IRF3&9-/- MEFs, respectively) for 6h (WT and IRF3-/- MEFs) or for 24h (IRF3&9-/- MEFs). The fold change in transcript expression levels compared to levels in mock treated cells were measured using real time PCR arrays. These results are representative of two independent experiments. Transcript levels for the PCR array housekeeping genes (D) and IRF family members (E) were compared between mock treated WT, IRF3-/- and IRF3&9-/- MEFs. Differences in Ct values were not statistically significant, with the exception of β actin in IRF3&9-/- MEFs, which was found to be expressed at lower levels when compared to WT, but not IRF3-/-, MEFs. For each gene a one-way ANOVA was performed with a tukey post test, * p<0.05.