Figure 3.
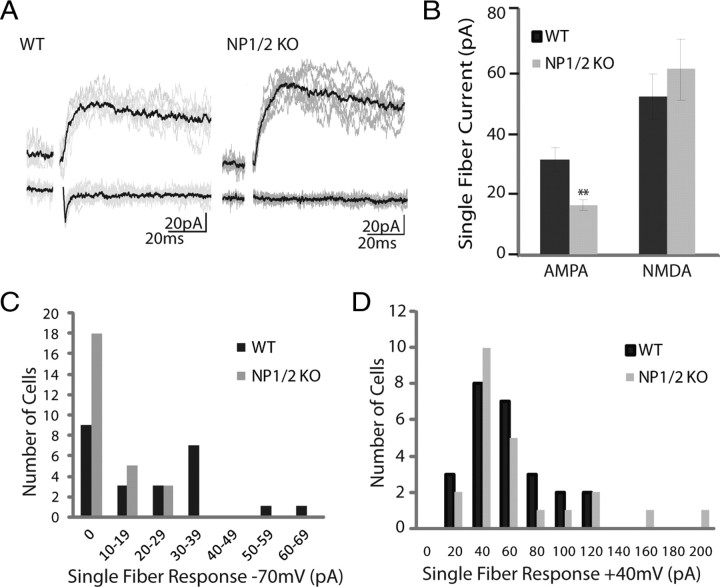
Young NP1/2 KO dLGN neurons (P6 through P9) have an increased number of silent synapses. A, Example traces from WT (left) and NP1/2 KO (right) neurons at +40 and −70 mV showing responses to minimal stimulation (7.5 μA for both cells). WT neuron shows responses at both +40 and −70 mV, whereas NP1/2 KO neuron shows a response only at +40 mV. B, Average amplitudes of presumed single fiber responses at −70 mV and +40 mV. C, Histogram of single fiber responses of WT and NP1/2 KO neurons held at −70 mV. Note the increase in the number of NP1/2 KO neurons that showed no response. D, Histogram of single fiber responses of WT and NP1/2 KO neurons held at +40 mV. B–D, Data displayed as mean ± SEM. **p < 0.01. Dataset included 24 cells from 8 WT animals and 26 cells from 6 KO animals.

