
Figure 5.
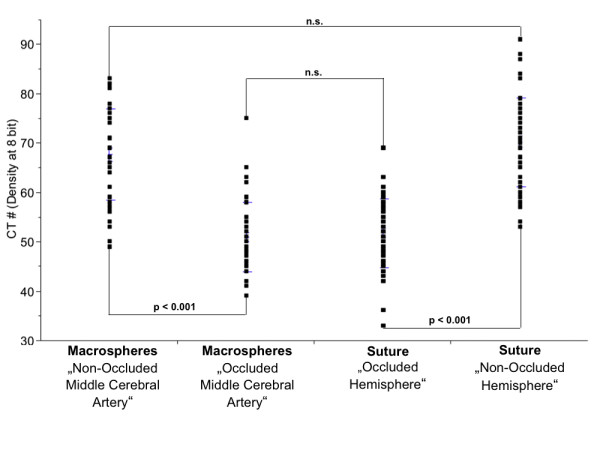
Gray scale attenuation differences obtained in Controls, the Macrosphere- and Suture Model. Significant differences in CT gray scale attenuations were obtained in different perfusion territories between the macrospheres and the suture technique. No significant differences were obtained for macrospheres in the middle cerebral artery and the suture model.