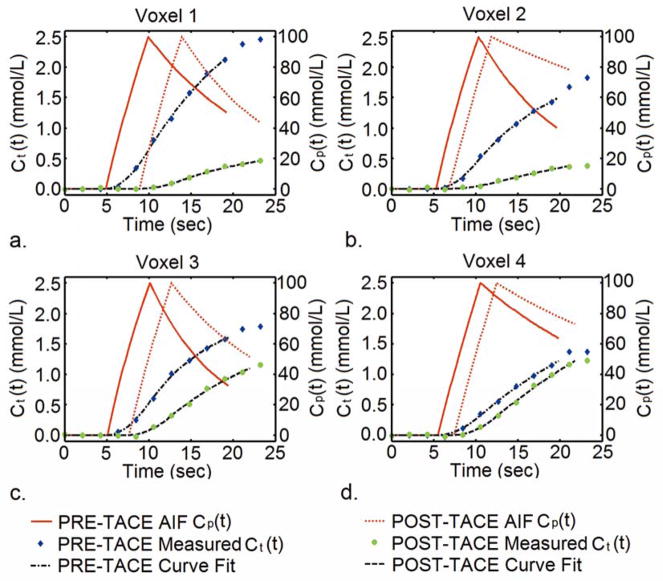
Figure 1.
Graphs show the measured Ct(t) curves, estimated AIFs (Cp(t)), and associated interpolated curve fitting using proposed first-pass perfusion model for individual tumor voxels from one representative patient before and after TACE. The measured Ct(t) curves clearly exhibited alteration in contrast uptake kinetics due to TACE.

