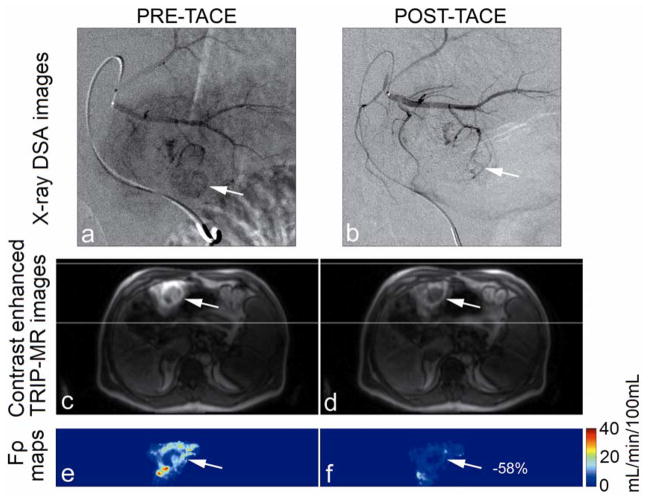
Figure 2.
Representative x-ray DSA-MRI monitored TACE images obtained in a 51-year-old patient with segment III HCC. X-ray DSA image before TACE (a) demonstrates catheter positioning, arterial structure, normal antegrade blood flow, and tumor blush (arrow). Post-TACE x-ray DSA image (b) demonstrates reduced antegrade blood flow and no tumor blush. Axial pre-TACE 4D TRIP-MR image after intraarterial contrast injection at peak enhancement (c) shows segmental liver enhancement and tumor position (arrows), and post-TACE peak enhanced 4D TRIP-MR image (d) shows reduced tumor contrast uptake; corresponding intra-procedural pre-TACE Fρ map (e) indicates baseline blood flow and post-TACE Fρ map (f) indicates reduced blood flow, in the tumor within the targeted vascular territories. The percentage perfusion reduction is listed in the post-TACE perfusion map.

