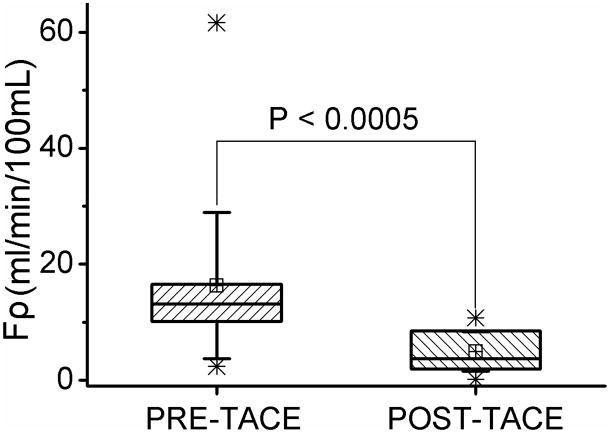
Figure 6.
Box plot show the distribution of intra-procedural tumor perfusion and a statistically significant tumor Fρ reduction after TACE. Boxes represent the lower and upper quartiles; line inside each box labels the 50th percentile (median); small crossed squares show the mean value; whiskers indicate the standard deviation; Stars (*) represent one and ninety-nine percentiles.

