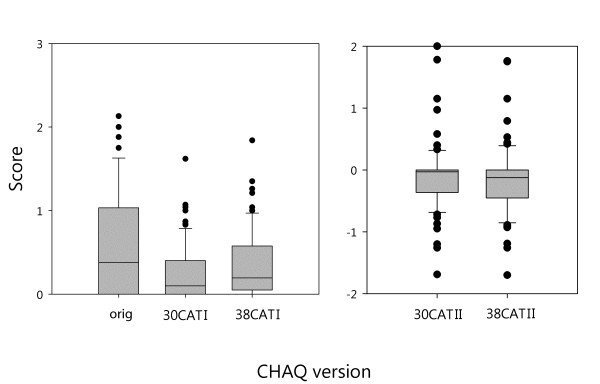
Figure 3.
Box and whisker plots of the scores on the original and revised versions of the CHAQ. The box contains 50% of all values (the 25th to 75th percentile) and is divided by the horizontal bar which is the median value (50th percentile). The whiskers show the remainder of the distribution (1.5 × Inter Quartile Range). Outliers are shown as dots.

