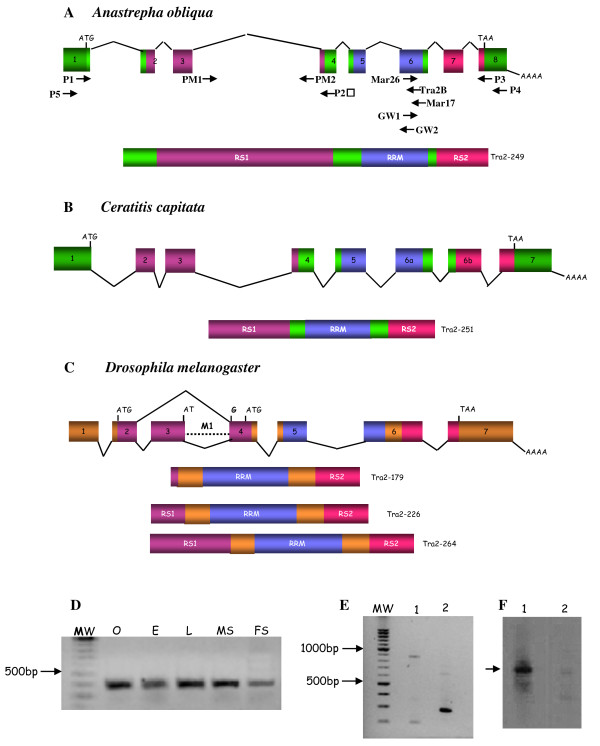
Figure 1.
Comparison of the molecular organisation of the tra-2 of A. obliqua (A), C. capitata (B) and D. melanogaster (C) and their proteins. Exons (boxes) and introns (dashed lines) are not drawn to scale. The numbers inside the boxes indicate the number of the exon. The beginning and the end of the ORF are indicated by ATG and TAA respectively. AAA stands for poly-A(+). (D) Expression of gene tra-2 of A. obliqua. RT-PCR analyses of total RNA from ovaries (O), embryos (E), from male and female larvae (L), male soma (head plus thorax, MS) and female soma (head plus thorax, FS). (E) Expression of gene tra-2 of A. obliqua. RT-PCR analysis of total RNA from A. obliqua testis. Lane 1 corresponds to PCR with primers PM1 and P2; lane 2 corresponds to PCR with primers P1 and P2 (see location of primers in Figure 1A). (F) Southern-blot corresponding to the gel shown in (E) and hybridisation with a probe specific for intron 3 of A. obliqua. The arrow marks the hybridisation to the higher band in lane 1 of Figure 1E. The size of the mRNAs encoding the proteins shown in this figure are: 1923 bp for A. obliqua mRNA, 1113 bp for C. capitata mRNA, and 960, 1583 and 1391 bp for D. melanogaster mRNAs tra2-179, tra2-226 and tra2-264, respectively.

