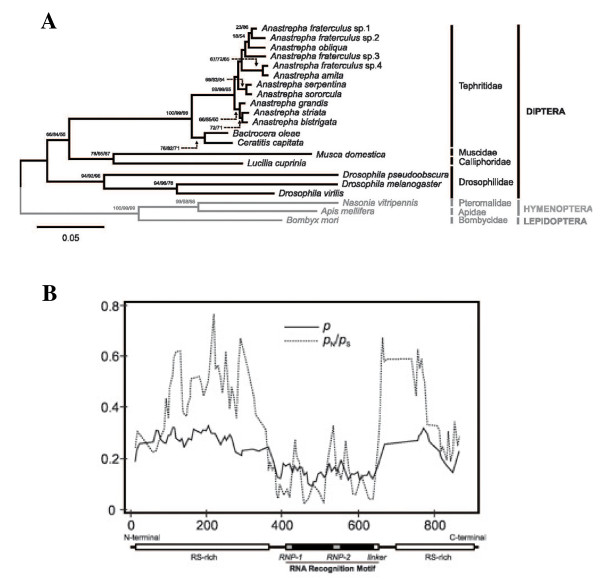
Figure 5.
Molecular evolution of Tra2 proteins. (A) Amino acid phylogeny encompassing Tra2 proteins from Diptera. Taxonomic relationships are indicated in the right margin of the tree. Numbers for interior nodes represent bootstrap and confidence probabilities based on 1000 replicates, followed by the BP corresponding to the maximum parsimony tree topology (shown only when greater than 50%). The topology was rooted with the Tra2 protein from the lepidopteran B. mori and the hymenopterans A. mellifera and N. vitripennis. (B) Proportion of nucleotide sites at which two sequences being compared were different (p, nucleotide substitutions per site) and ratio between the numbers of non-synonymous (pN) and synonymous (pS) substitutions per site across the coding regions of tra-2 in the analysed species. The different functional regions defined for the Tra2 proteins are indicated below the graph.

