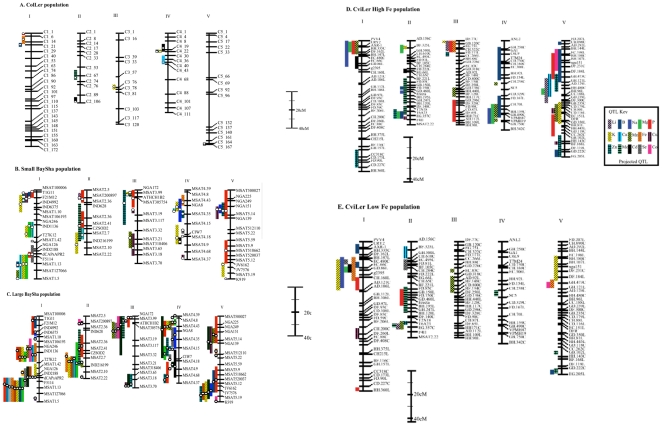
Figure 2. Chromosome maps with QTL noted for each element in which QTL were identified.
The white circle within the colorful boxes represents the estimated location of the QTL. A. QTL identified in RIL ColLer. B. QTL identified in RIL BaySha, Sunshine growth medium. C. QTL identified in RIL BaySha, Promix growth medium. D. QTL identified in RIL CviLer, high Fe environment. E. QTL identified in RIL CviLer, low Fe environment.

