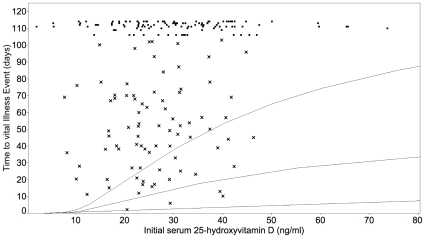
Figure 2. Length of time to viral infection related to initial serum concentration of 25-hydroxyvitamin D.
Shown are the results of the pharmacodynamic model relating 25-hydroxyvitamin D to length of time before a viral respiratory tract infection. The model equation is Log(time to event) = b0+b1/(Maximal 25OH-Vit D–serum 25-OH vitamin D+1) calculated using a Weibull loss function. The parameters associated with the regression are as follows, given with 95% CI and P-values: b0 = 4.29 (3.50–4.96), <0.001; b1 = 38.33 (9.64–76.48), <0.001; Sigma = 0.79 (0.65–0.97), <0.001. Overall P-value for this model was <0.0023. Curves are fitted 0.1, 0.5 and 0.9 quantiles as a function of the regressor. The x points represent individuals who developed viral infections, and the other points represent individuals who did not develop infections and the three who were not followed until the end of the observation period. For the individuals who developed viral infections (x points) the mean age was 46.9 years; there were 47% men; 76.5% had light pigmentation, 18.8% intermediate pigmentation, 4.7% dark pigmentation; the mean initial 25-hydroxyvitamin D concentration was 26.12 ng/ml; and the mean vitamin D supplementation 292.5 IU. For the individuals who did not develop viral infections (the other points) the mean age was 47.0 years; there were 39.8% men; 78.8% had light pigmentation, 14.2% intermediate pigmentation, 7.0% dark pigmentation; the mean initial 25-hydroxyvitamin D concentration was 30.03 ng/ml; and the mean vitamin D supplementation 601.4 IU.

