
Figure 2. Binding specificity of the CHD4 PHD2 finger was established using positional discrimination factors.
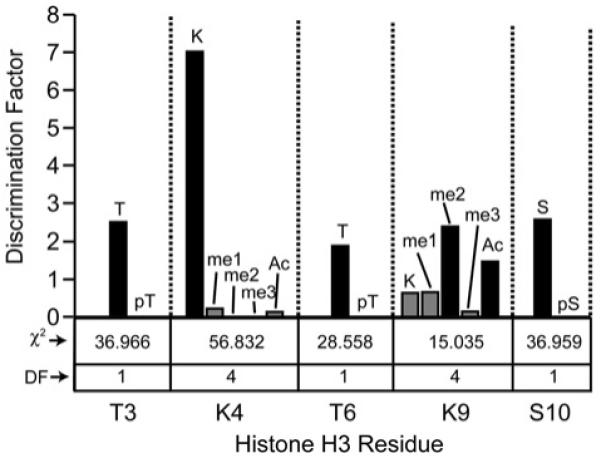
The discrimination factor for a single modification at any one position is calculated as a mathematical ratio of frequencies between the results of screening the library against CHD4 PHD2 and a random library sampling (50 sequences). A larger discrimination factor (a larger bar in graph) represents a modification favouring binding. A discrimination factor of 1 denotes no difference between the CHD4 screen and a random bead sampling. χ2 analysis was performed at each position. For positions with 4 (n–1) degrees of freedom (DF), a χ2 value greater than 13.28 denotes statistical significance at a 99% confidence level. Positions with 1 degree of freedom (DF) must have a value greater than 6.63 in order to be considered statistically significant at the 99% confidence level. A non-significant result means that no effects were discovered and chance could explain the observed differences at that position. The modification states at positions Thr3 (T, pT), Lys4 (K, Kme1, Kme2, Kme3, Kac), Thr6 (T, pT), Lys9(K, Kme1, Kme2, Kme3, Kac) and Ser10 (S, pS) are shown. ac, acetylated; me, methylated; p, phosphorylated. We note that K9me3 is not well represented in the screen. This could be due to the sample size, which was not large enough to resolve all tendencies at this position and because any of the three modifications (acetylation, di- and tri-methylation) results in enhanced binding. Additionally, based on χ2 analysis, PTM discrimination at Lys9 is less pronounced compared with positions 3, 4 and 6.