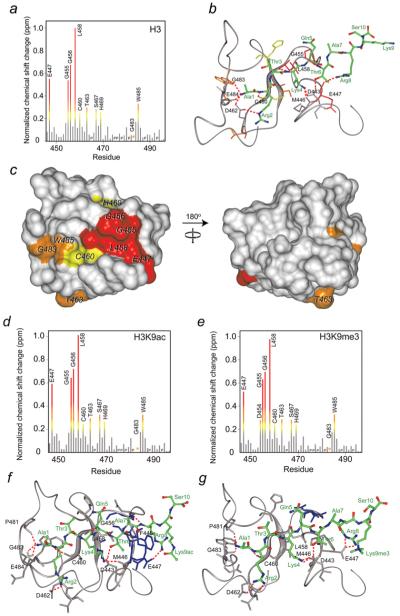
Figure 4. Identification of the H3-, H3K9ac- and H3K9me3-binding sites of the CHD4 PHD2 finger and models of the PHD2-H3, PHD2-H3K9ac and PHD2-H3K9me3 complexes.
(a, d and e) The histograms show normalized 1H, 15N chemical shift changes in backbone amides of PHD2 upon addition of the H3 (a), H3K9ac (d) and H3K9me3 (e) peptides. An asterisk indicates the disappearance of the resonances, and P indicates a proline residue. (b, f and g) Models of the PHD2–H3, PHD2–H3K9ac and PHD2–H3K9me3 complexes as obtained using the flexible docking program HADDOCK. Residues of PHD2 and H3 are labelled in black and green, respectively. Hydrogen bonds and salt bridges are shown by red dotted lines. (c) Residues that exhibit significant H3-induced resonance perturbations [more than average plus one quarter (yellow), one half (orange) and one (red) standard deviation] in (a) are mapped onto the surface of the ligand-free CHD4 PHD2 [24] and labelled.

