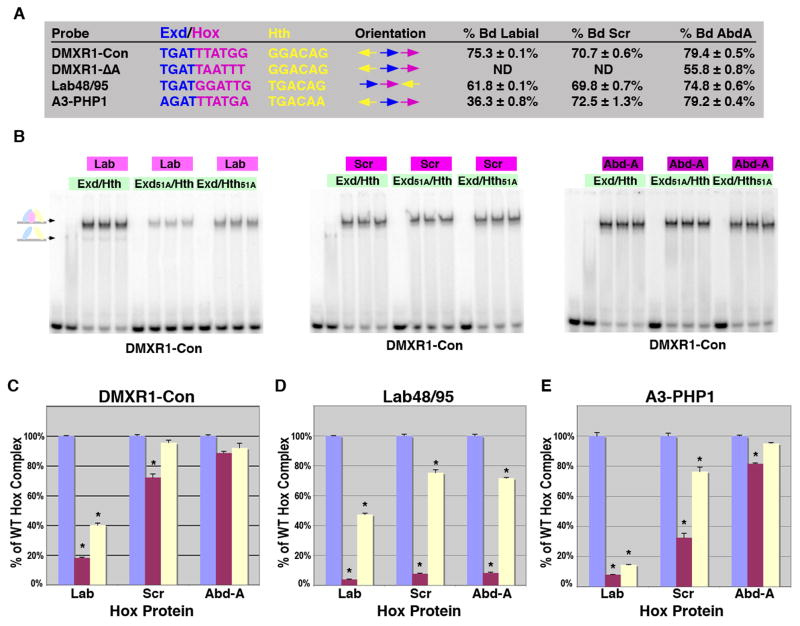
Figure 6. Differences in complex formation between anterior and posterior Hox factors.
A. The DNA probes tested for Hox complex formation in gel shift assays using Lab, Scr and Abd-A. Comparisons between the Exd/Hox sites, Hth sites and orientations between sites are highlighted. The percent of probe bound by Lab (110 × 10-9 M), Scr (100 × 10-9 M) and Abd-A (75 × 10-9 M) with a constant amount of Exd/Hth (75 × 10-9 M) in triplicate is noted. B. Comparative EMSAs on the DMXR1-Con probe using wild type and mutant Exd/Hth heterodimers (30 × 10-9 M) with Lab (110 × 10-9 M), Scr (100 × 10-9 M) or Abd-A (75 × 10-9 M) as indicated. C-E. Assessing the dependence of Hox complex formation on Exd and Hth binding to DMXR1-Con (C), Lab48/95 (D), and, Hoxa3-PHP1 (E). Comparative DNA binding assays were performed in triplicate using equimolar amounts of Exd/Hth, Exd51A/Hth, and Exd/Hth51A proteins (30 × 10-9 M) and Lab (110 × 10-9 M), Scr (100 × 10-9 M) or Abd-A (75 × 10-9 M). The amount of probe bound by each Hox factor with wild type Exd/Hth was assigned to 100% (blue bar). The amount of probe bound by Exd51A/Hth (red bar) and Exd/Hth51A (yellow bar) compared to wild type was then determined. * denotes a significant difference from wild type binding (p-value < 0.001).

