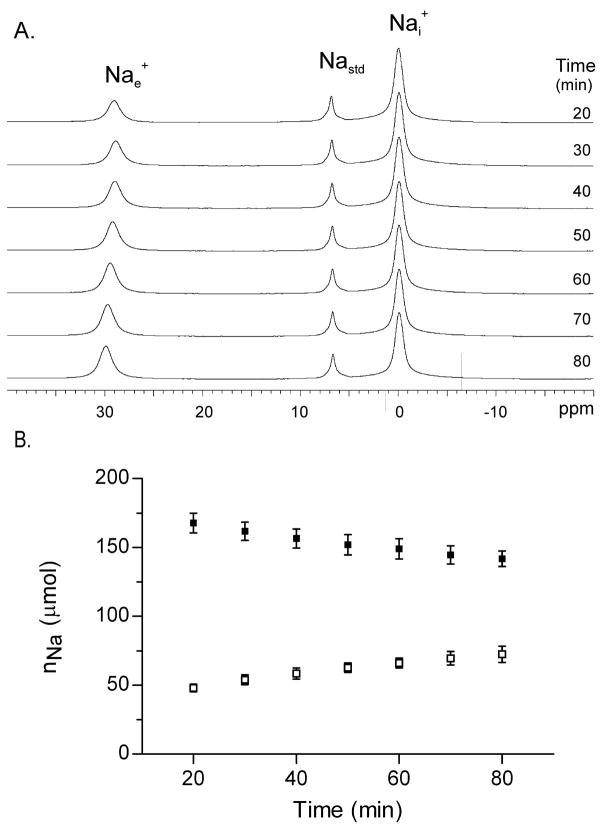
Figure 1. Na+ efflux from Na+ loaded yeast 23Na MR spectroscopy.
Panel A: Stacked 23Na MR spectra obtained from a suspension of Na+ loaded yeast in which the SRe, [TmDOTPe5−] was 12.8 mM. The 3 23Na resonances are identified as follows (left to right) (1), the extracellular Na (Nae+); (2), the Na standard (Nastd), which contains TmDOTP5−; and, (3), the intracellular Na (Nai+).
Panel B: The Na+ contents, nNai (filled square) and nNae (open square), of suspensions of Na+ loaded yeast (n=4) measured by MRS with SRe. Mean ± (SD) values are plotted.

