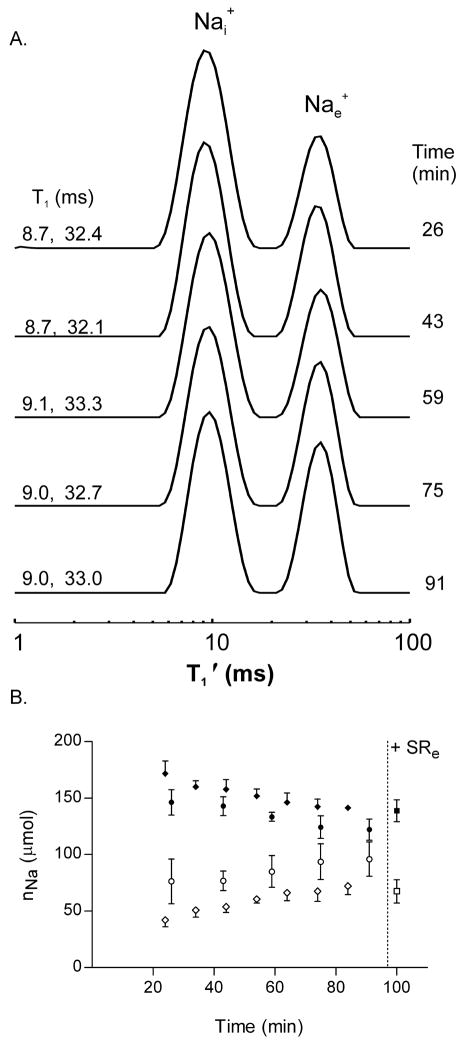
Figure 5. Na+ efflux from Na+ loaded yeast intrinsic T1 23Na MRR.
Panel A: A stacked plot of Na T1 relaxograms of a suspension of Na+ loaded yeast is shown. No RRe was added to the sample; the relaxogram peaks represent the distribution of intrinsic T1 values in the sample. The T1 values obtained from each relaxogram peak are shown on the left; the elapsed time to the middle of the relaxogram acquisition is shown on the right.
Panel B: The time dependence of the Na+ contents, nNai (filled circle) and nNae (open circle), of suspensions of Na+-loaded yeast (n=4) derived from 23Na intrinsic T1 MRR measures. At 97 min SR was added to the suspension and the MRS/SRe measured nNai (filled square) and nNae (open square) values were obtained. For comparison the MRR/RRe nNai (filled diamond) and nNae (open diamond) amounts (Fig 4B) are shown. All values are mean ± (SD).

