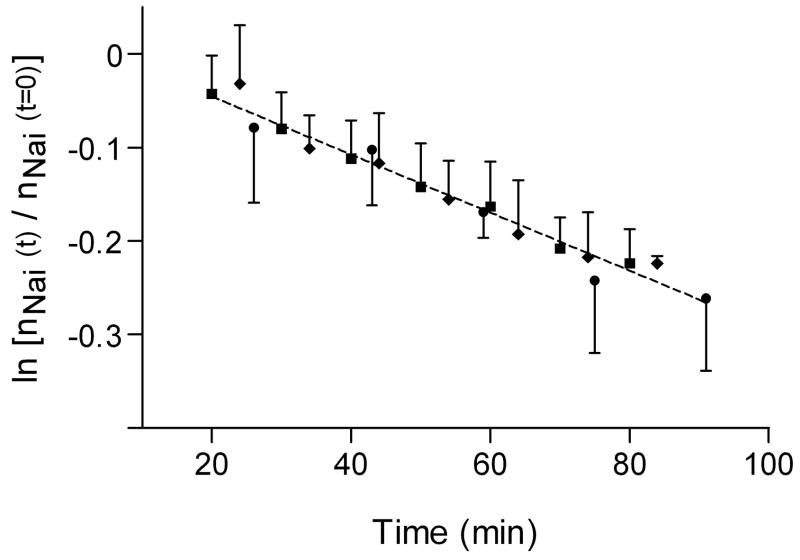
Figure 6. Na+ Efflux kinetics.
A plot of the time dependence of ln[nNai(t)/nNai(t=0)] from the MRS/SRe results (filled squares), MRR/RRe results (filled diamonds) and intrinsic T1 MRR results (filled circles). All three data sets were fit to straight lines. The hypothesis was tested that the slope was different for the three lines individually fit to each set of data (p = 0.98). Thus, the slopes are equal for all three data sets. The common slope was 3.1 (± 0.3) ×10−3 min−1; thus, the k = 3.1 (± 0.3) ×10−3 min−1. A single line with an intercept of 0.016 (± 0.015) and the above slope fit to the three sets of data (R2 = 0.67) is shown.

