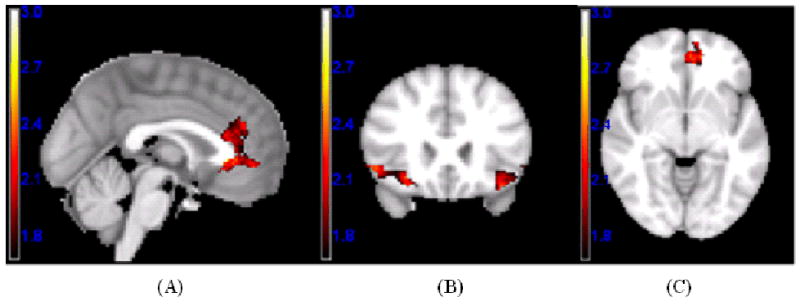
Figure 2.

Significant linear responses to variations in facial attractiveness using a voxel-level threshold p < .05 and a cluster-extent threshold derived from Alphasim (Ward, 2000) to achieve an overall alpha of p < .05, Z-maps are illustrated in the following regions: (A) ACC (Positive linear effect); (B) left and right LOFC (Negative linear effect); (C) left MOFC (Positive linear effect).
