
Figure 9.
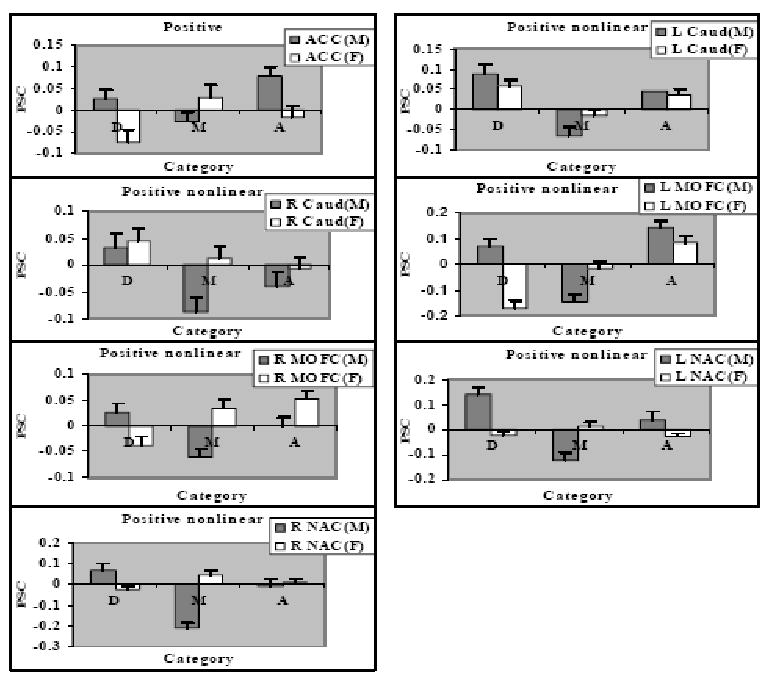
Gender differences in the positive nonlinear effect of attractiveness shown in percent signal change (PSC) to disfigured faces, D, medium attractive faces, M, and attractive faces, A, in 7 ROIs: (A) ACC; (B) Left Caudate; (C) Right Caudate; (D) Left MOFC; (E) Right MOFC; (F) Left NAC; (G) Right NAC. Table 1. Brain regions in which parametric analyses of BOLD signal revealed linear or nonlinear effects with respect to facial attractiveness ratings.