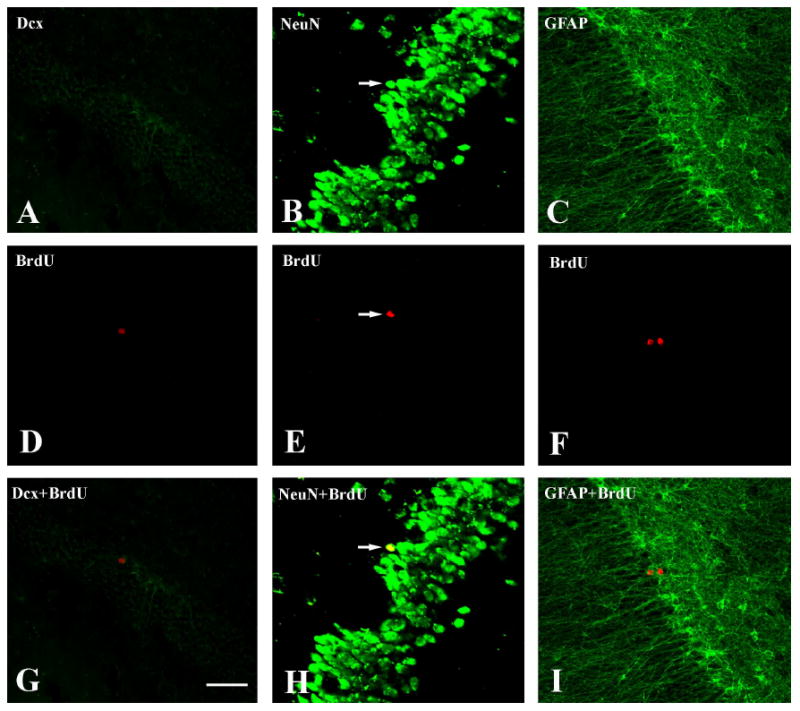
Figure 3.

Confocal laser scanning microscopy from the section illustrating colocalization of BrdU with Dcx (A.D.G), NeuN (B,E,H), and GFAP (C,F,I) within within DG from the OVX-E-Con monkey. Upper column shows Delight 488-labeled different cell-specific markers including Dcx (A), NeuN (B), and GFAP (C). Middle column shows Delight 549-labeled BrdU-ir cells within the same sections as the upper column. Lower column shows the colocalization of upper column and the middle column. Note that: Some BrdU-ir cells were NeuN-ir positive (arrow pointed). No BrdU-ir cell was Dcx-ir or GFAP-ir positive. Scale bar in G represents 100μm for all images.
