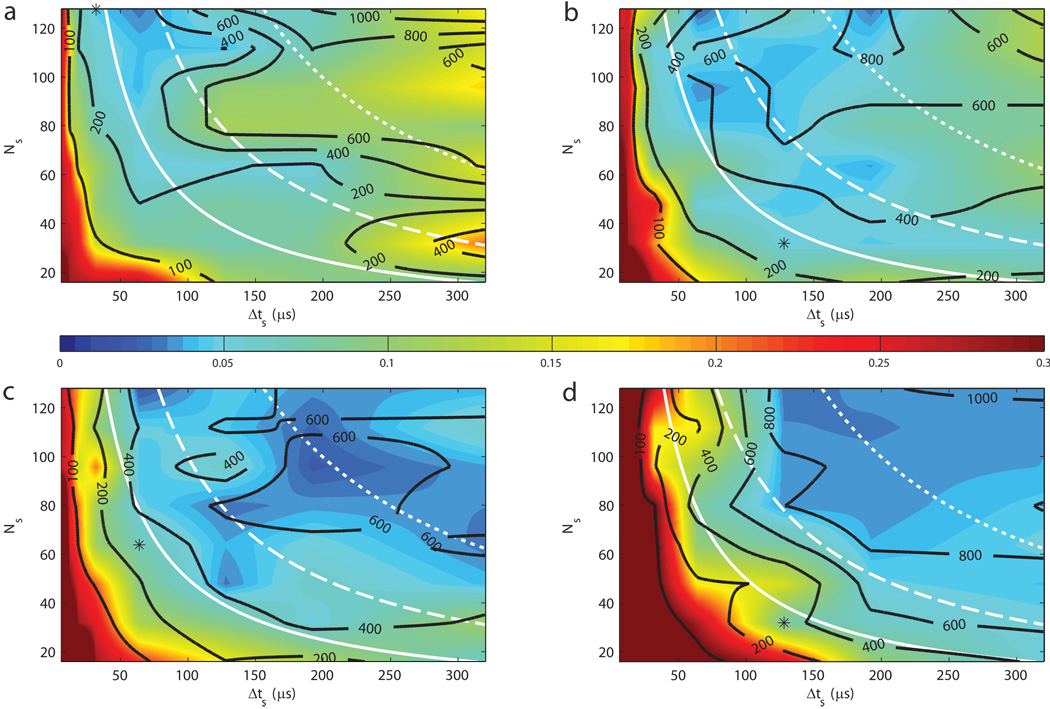
Figure 5.
Results of composite pulse optimizations interpolated across the 2D parameter space of sub-pulse duration (Δts) and the number of sub-pulses (Ns) with sub-figures (a), (b), (c), and (d) corresponding respectively to α0 values of 30°, 60°, 90°, and 180°. Color scale indicates the minimized function value (δα); black contours give corresponding minimum repetition times (TR,min) in milliseconds; solid, dashed, and dotted white lines are isocontours of total pulse duration (ΔT) at 5, 10, and 20 ms, respectively. Black asterisks indicate the values of Ns and Δts for the optimized pulses specifically compared to block and BIR-4 pulses in Figs. 6, 7, and 8 and Table 1. Data indicate that the lowest values of δα migrate toward the top right corner of the parameter space with increasing α0—thus reflecting increased power requirements. At lower α0, δα minima tend to be found in the upper left, suggesting that the maximum number of short-duration sub-pulses yields the best performance given that a certain power threshold is satisfied.

