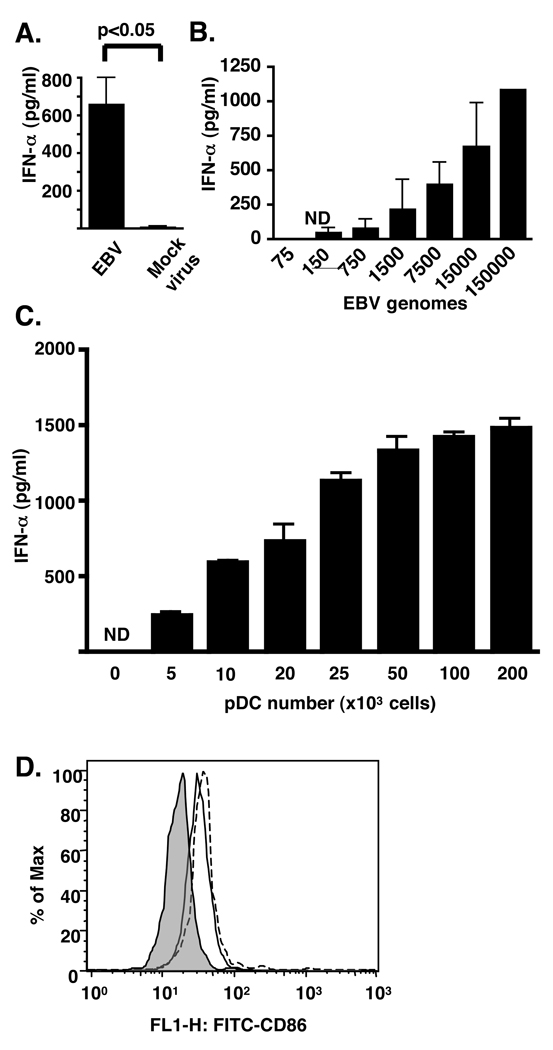
Figure 1. EBV promotes IFN-α production and CD86 upregulation by pDC.
Fifty thousand pDC sorted by flow cytometry were incubated with (A) purified EBV (15,000 genomes) or mock virus for 18 h, or (B) increasing numbers of viral genomes. (C) Increasing numbers of pDC were incubated with 15,000 genomes of EBV. (D) pDC were cultured with EBV (solid line, 15,000 genomes), CpG DNA (broken line, 63nM) or with buffer control (shaded line), and CD86 expression determined by flow cytometry. Supernatants and cells were harvested 18 h after beginning incubations. In A–C, IFN-α in supernatants was measured by ELISA. In A, error bars represent SD, with experiments done in triplicate. In B and C, error bars represent SD of duplicate wells. ND (not detected) represents IFN-α amounts of less than 12.5 pg/ml. Statistics performed by Mann-Whitney testing.

