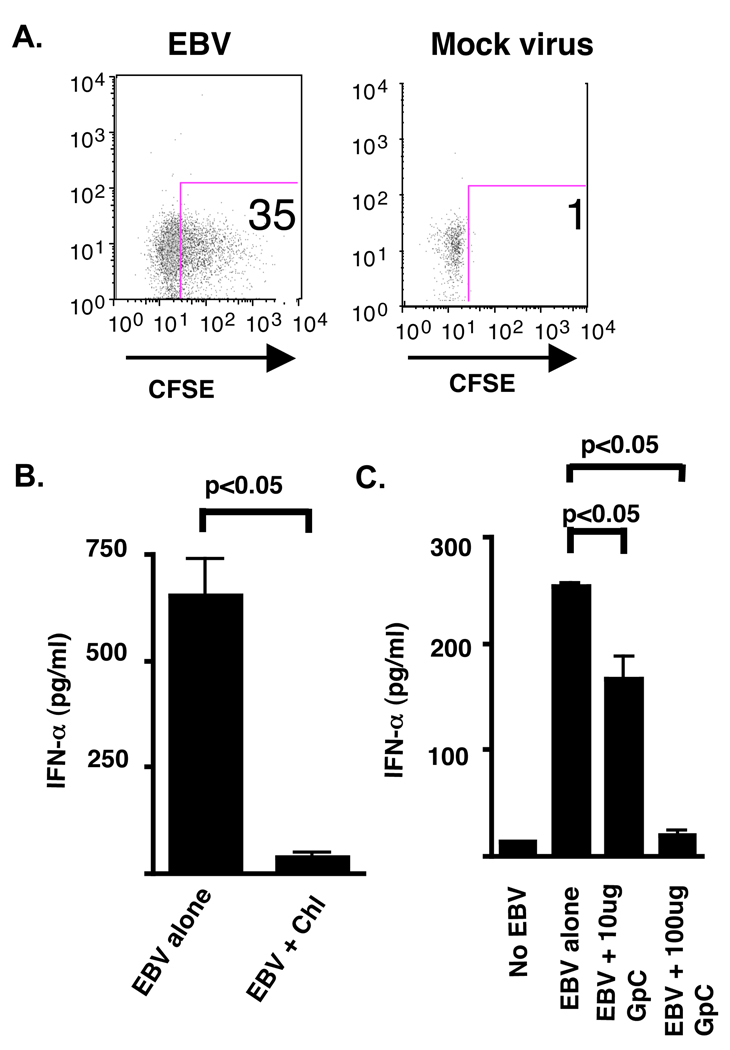
Figure 4. IFN-α production by pDC is dependent upon viral entry, endosomal acidification, and TLR9 engagement.
pDC were stimulated for 18 h in the presence of CFSE-labeled EBV (15,000 genomes) or mock virus with (A) viral interaction assessed by flow cytometry. (B) pDC (50,000 cells) sorted by flow cytometry were stimulated for 18 h in the presence of EBV (15,000 genomes) with or without pre-incubation with chloroquine (chl; 10 µm) or (C) in the presence of increasing amounts of the inhibitory deoxynucleotide GpC 2006. IFN-α levels were measured from the supernatants by ELISA. Greater than 90% of cells were viable after stimulation as determined by trypan blue staining. Error bars represent SD for experiments done in duplicate. ND (not detected) represents IFN-α less than 12.5 pg/ml. In (B) statistical analysis was performed by Mann-Whitney testing. Statistics in (C) performed by 1-Way ANOVA followed by Dunnett’s comparison.

