
Figure 3.
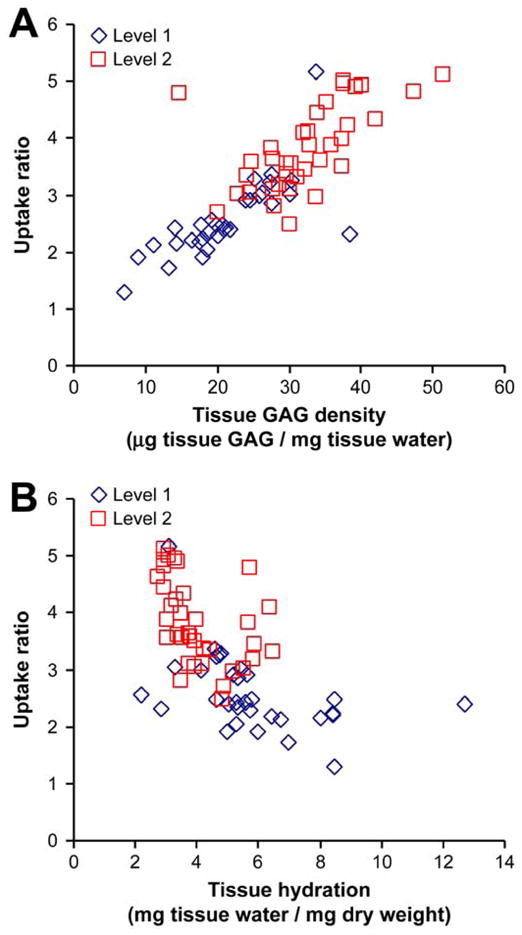
Dependence of the uptake ratio of 125I-Pf-pep on (a) tissue GAG density (μg GAG content/mg tissue water) and (b) tissue hydration (mg tissue water/mg dry weight). Uptake of 125I-Pf-pep increased with increasing tissue sGAG content and with decreasing tissue hydration (linear regression, p <0.0001). Cartilage from the deeper region (L2) generally had higher GAG density (t-test, p <0.0001) and lower hydration (t-test, p = 0.00016) than L1 tissue. Each data point represents one of the 68 cartilage specimens that comprise the data-set of Fig. 2.