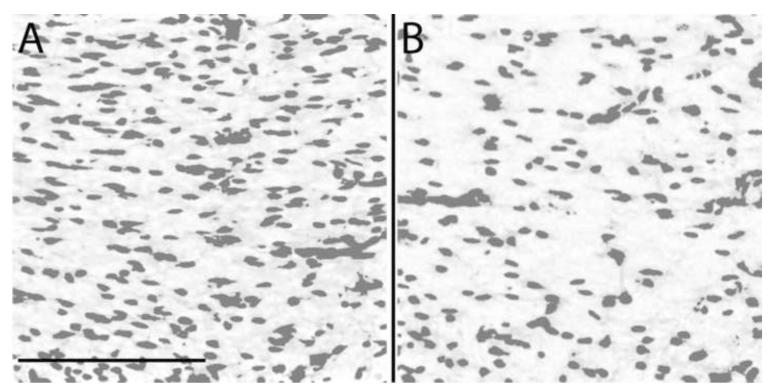
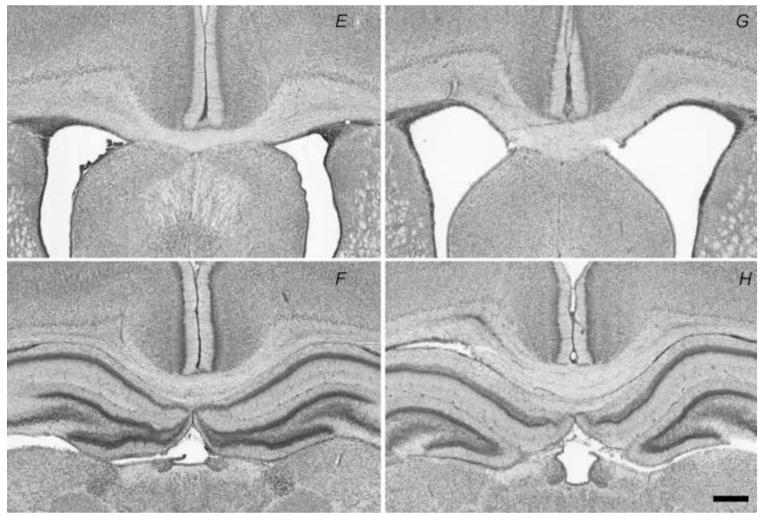
Figure 7.
Proportion of the section areas containing cresyl violet positive stain of the corpus callosum 4 days after injection of normal saline alone (CTR) (A) or LPS (B) after a rolling-ball background removal algorithm with area covered by the cells using thresholding. (C) Bar graph of the proportion of the section areas containing cresyl violet positive stain of the corpus callosum 4 days after injection of LPS or normal saline alone (CTR). Note the significant decrease of the proportion of the section areas containing cresyl violet positive stain in animals exposed to LPS (* p = 0.014). (D) Bar graph of the mean thickness of the corpus callosum. Note the significant increase of the corpus callosum thickness in animals exposed to LPS (** p = 0.0013). Cresyl violet stain centered on the corpus callosum of a CTR animal (E-F), and an injured rat pup with LPS (G-H). Note the increase thickness of the corpus callosum. Scale bar is 0.5 mm.


