
Fig. 1.
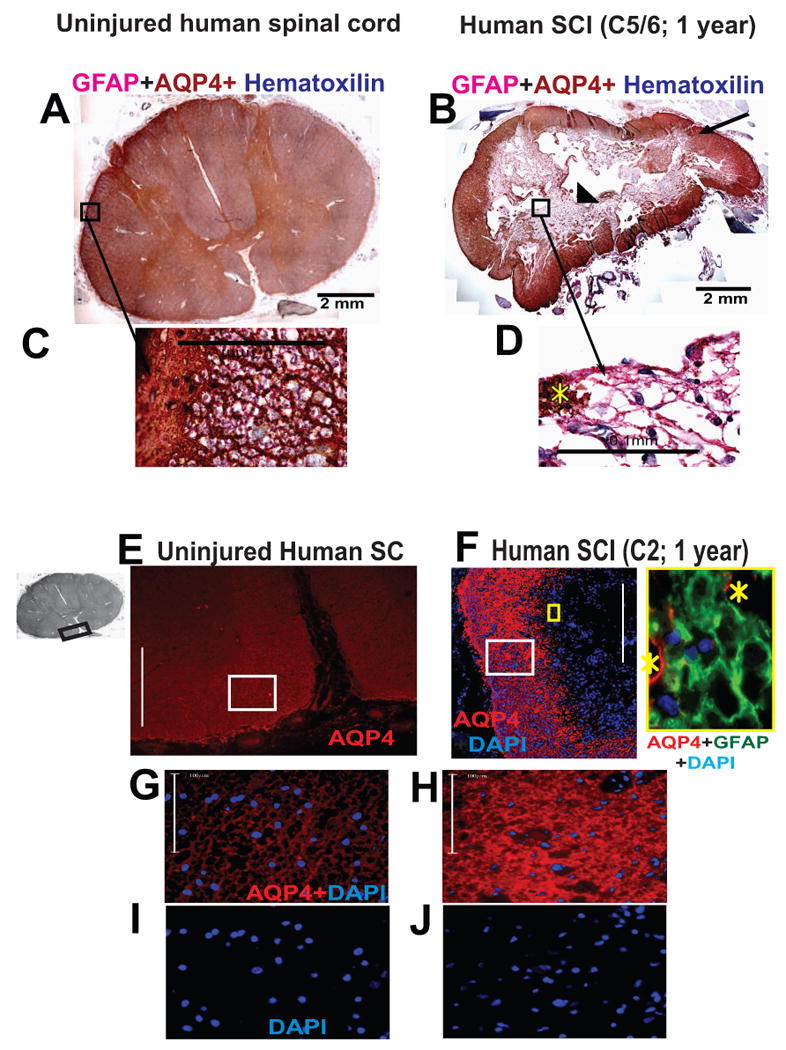
An immunohistochemical procedure was used to detect GFAP and AQP4 in human spinal cord sections. GFAP was detected with an alkaline phosphatase secondary detection system and a substrate that gave a pink precipitate from fast red chromogen. AQP4 was detected with LSAB2 system-horse radish peroxidase and DAB substrate that gave a brown end-product at the site of the target antigen. Counterstaining to detect nuclei was performed with Harris hematoxylin (dark blue). A) Uninjured human spinal cord section labeled with GFAP (red) and AQP4 (brown). Here we present cervical spinal cord section, but the same AQP4 expression pattern was found in thoracic and lumbar sections. B) Injured human spinal cord at the epicenter (C7), isolated from an SCI patient, one year after SCI. This case (No. 29) is described in Guest et al., 2005. C) Large magnification of astrocytes in the region of glia limitans externa (marked with white star) of uninjured cord clearly showing GFAP and AQP4 co-expression. Yellow star marks “islands” of AQP4 labeling among AQP4-negative astrocytes. Calibration line: 100 μm. D) GFAP-labeled astrocytes (pink) around the cyst were devoid of AQP4. Calibration line: 100 μm. E) Immunofluoresecent detection of AQP4 (red) in ventral white matter of the uninjured spinal cords; the region of the spinal cord used in this image is marked with a black rectangle in the gray image of the whole section (insert on the left). Calibration line: 400 μm. F) Equivalent AQP4 labeling in the white mater rim in C2, one year after SCI (Patient No. 28; Guest et al., 2005) showed both AQP4-devoid region at the center of the section and visibly more AQP4 labeling compared to uninjured white or gray matter human spinal cords. Calibration line: 400 μm. The insert framed in yellow depicts high magnification image of astrocytes (GFAP labeled green) devoid of AQP4 (yellow square in the low magnification image). Yellow starts mark AQP4 labeling (red). G) High magnification images of the region marked by the white rectangle in E. Calibration line: 100 μm. H) High magnification images of the region marked by the white rectangle in F. Calibration line: 100 μm. I) Nuclear counterstain (DAPI) in the same image (shown in G). J) Nuclear counterstain (DAPI) in the same image (shown in H).