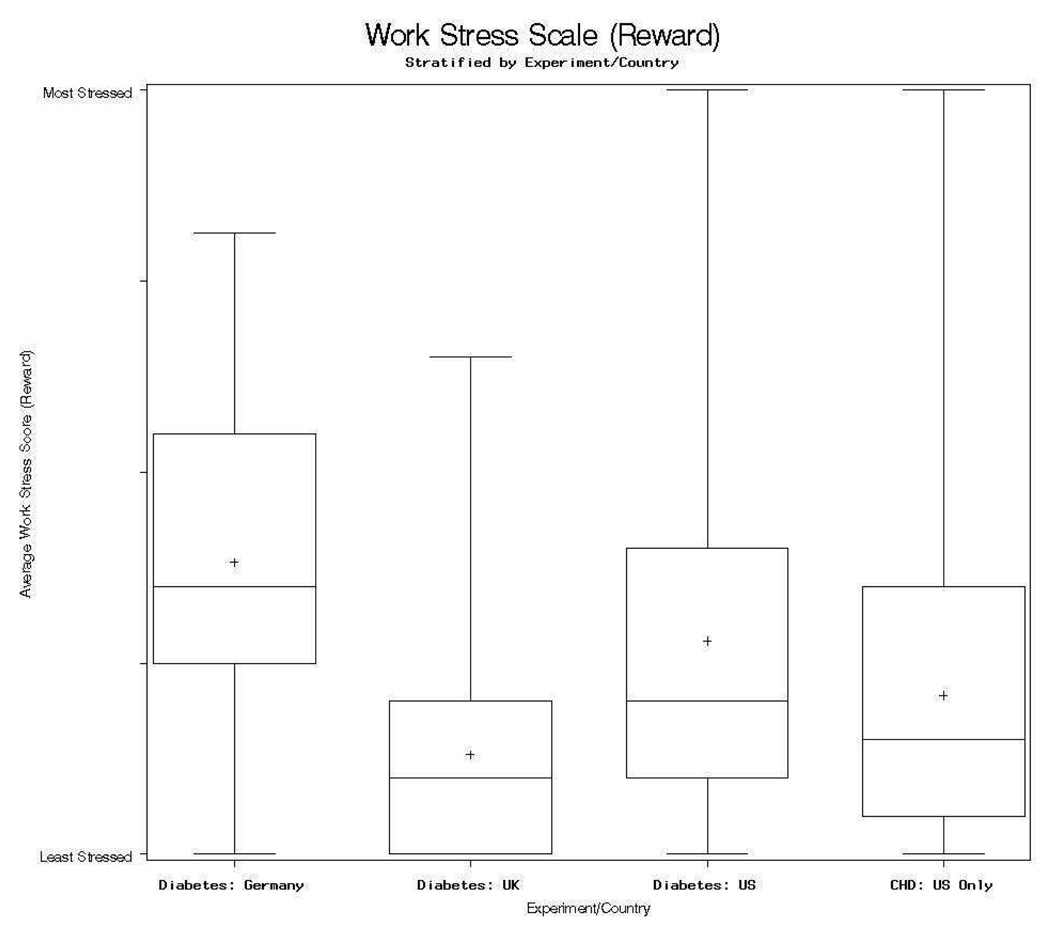
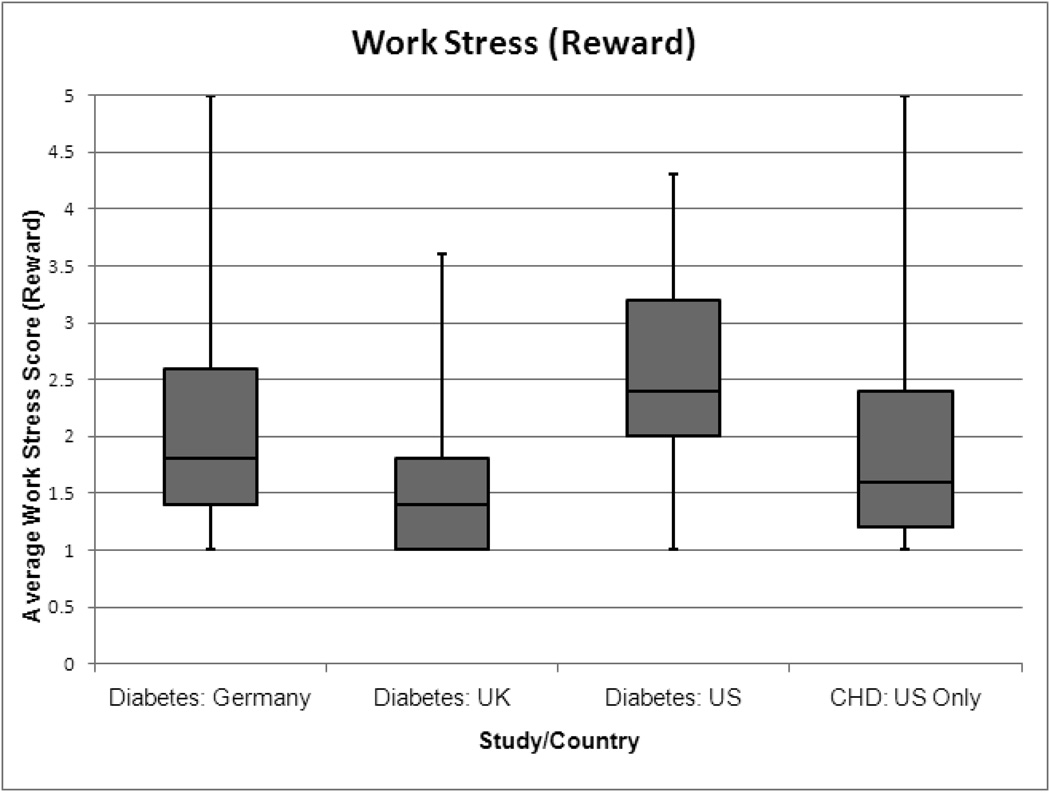
Figure 1.
Boxplot of work stress (reward subscale) by study/country
The box-plot graphically depicts work stress by country/study through five-number summaries: 1) the sample minimum is represented by the lowest whisker, 2) the lower quartile (Q1) is represented by the lowest line of the box, 3) the median (Q2) is the middle box line, 3) the upper quartile (Q3) is represented by the highest line of the box, and the sample maximum is represented by the highest whisker. Finally the + represents the sample mean.


