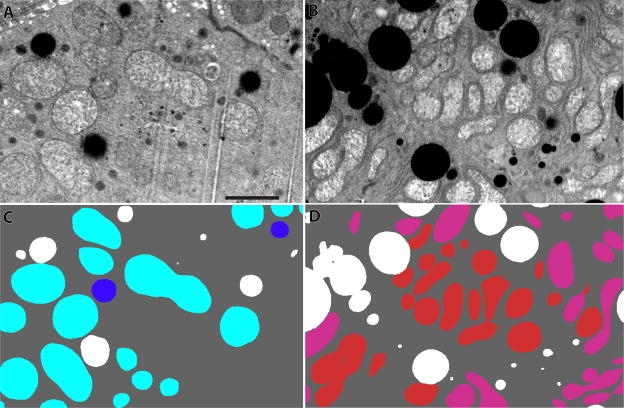
Figure 2.
Backscattered SEM images of murine liver cells. (A) A backscattered image of a portion of a control murine liver cell showing the density distribution. The dark objects are lipid bodies. (B) A backscattered image of a Mut −/− murine liver. (C) A segmentation of panel A with lipid in white, whole mitochondria in blue and partial mitochondria (those that run off the edges of the reconstructed volume) in aqua. (D) A segmentation of panel B with lipid again in white, whole mitochondria in red and partial mitochondria in pink. Mut −/− liver tissue has more and more contorted mitochondria. The scale bar is 2 μm.

