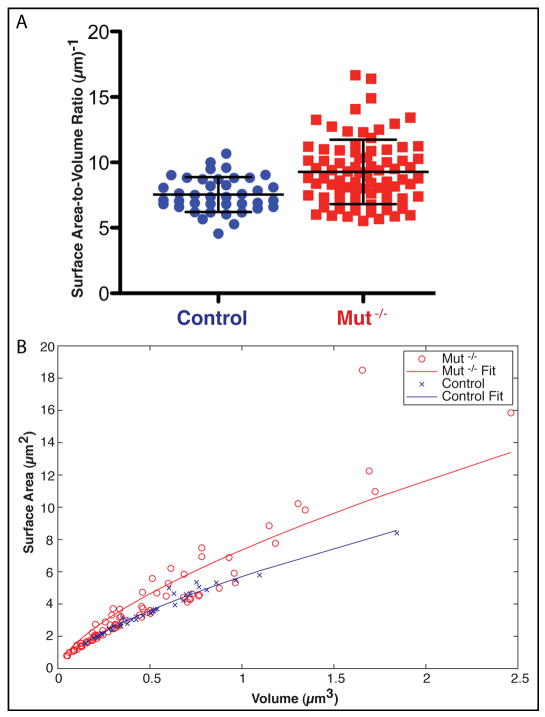
Figure 5.
Surface-area-to-volume ratios of the individual, whole mitochondria. (A) Surface-area-to-volume ratio column scatter plot, with delineated mean and standard deviation of the control and Mut −/− mitochondria. (B) Surface area plotted against volume. The lines are fit to the data, as explained in the text. Control data points are in blue, while Mut −/− data points are in red.

