Figure 6.
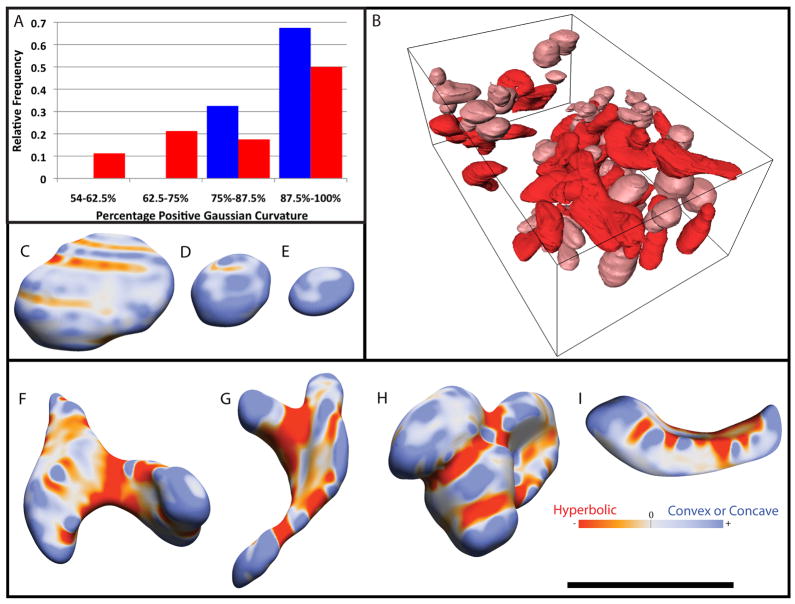
Curvature of the individual, whole mitochondria. (A) Measurement of curvature displayed as a histogram of percent positive (non-hyperbolic) Gaussian curvature. Control mitochondrial values are in blue and Mut −/− mitochondrial values are in red. (B) A 3D view of all eighty, whole Mut −/− mitochondria with normal shaped mitochondria in pink and abnormal shaped mitochondria in red. (C–E) Control mitochondrial shapes. The color bar shows that red is hyperbolic Gaussian curvature and blue is either concave or convex curvature. (F–I) Mut −/− mitochondrial shapes. The black scale bar is 2 μm.

