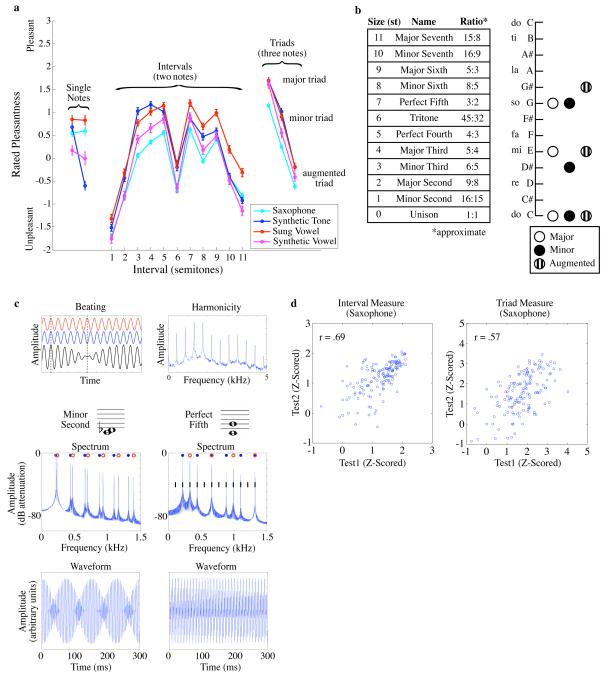
Fig. 1.
Consonance preferences and their possible acoustic basis. (A) Mean pleasantness ratings of individual notes and chords, for Cohort 1. The two single-note conditions differed in pitch (lower pitch on left). Error bars denote standard errors. (B) Intervals and chords used in experiments, with diatonic scale as reference. Ratios in stimuli approximated those listed in table, due to use of the equal-tempered scale. (C) Beating and harmonicity in consonant and dissonant intervals. Top left – two sinusoids of different frequencies are plotted in red and blue; their superposition (in black) contains amplitude modulation known as “beating”. Top right – amplitude spectrum for the note A440 played on an oboe. The frequencies in the note are all integer multiples of the fundamental frequency of 440 Hz, and as a result are regularly spaced along the frequency axis. Bottom rows – spectra and waveforms for the minor second and perfect fifth, generated by combining two synthetic complex tones with different fundamental frequencies. Red and blue circles denote the frequencies belonging to each note. The frequencies of the fifth are approximately harmonically related (black lines denote harmonic series). Amplitude modulation (from beating) is evident in the waveform of the minor second, but not the fifth. (D) Scatter plots of consonance measures computed from z-scored ratings of Cohort1 (saxophone notes) on two successive tests. The interval consonance measure was formed by subtracting the mean rating of the five lowest-rated intervals from that of the five highest-rated intervals. The triad consonance measure was formed by subtracting the ratings for the augmented triad from that of the major triad. Each circle denotes the scores of a single subject. Here and elsewhere, r is the Spearman correlation coefficient.

