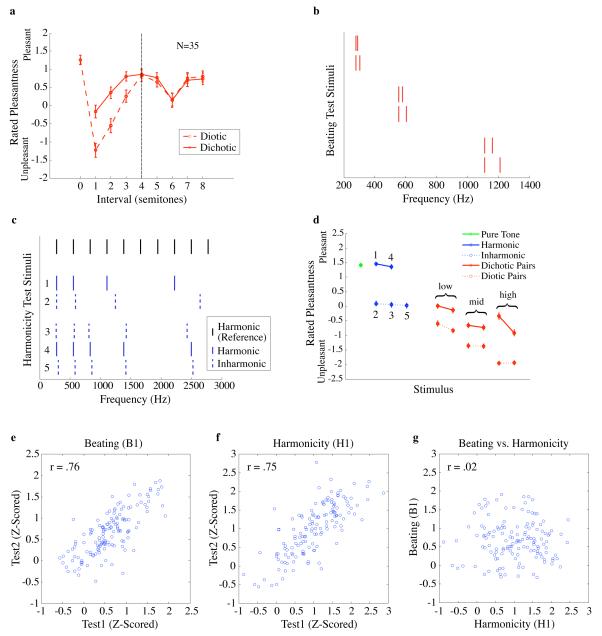
Fig. 2.
Diagnostic measures of beating and harmonicity. (A) Mean pleasantness ratings of 35 subjects for pairs of pure tones, diotically or dichotically presented. Error bars denote standard errors. The unison (0 semitone separation) could only be presented diotically. Dashed line represents the approximate frequency separation (derived from estimated cochlear filter bandwidths) at which beats become inaudible. (B) Schematic spectra of beating test stimuli. Tone pairs were separated by either 0.75 or 1.5 semitones, such that considerable beating was heard when presented diotically. (C) Schematic spectra of harmonicity test stimuli. Inharmonic complex tones were generated via small perturbations to the frequencies of each harmonic component, ensuring that all components were separated widely enough to avoid substantial beating. All other aspects of the harmonic/inharmonic test stimuli were identical. Numbers to left of spectra are to enable comparison with (D). (D) Mean pleasantness ratings of acoustic test stimuli, Cohort 1. Error bars denote standard errors. (E) & (F) Scatter plots of B1 and H1 measures computed from z-scored ratings of Cohort 1 on two successive tests. See also Figs. S1, S5. (G) Scatter plot of B1 and H1 measures, averaged over the two tests.

