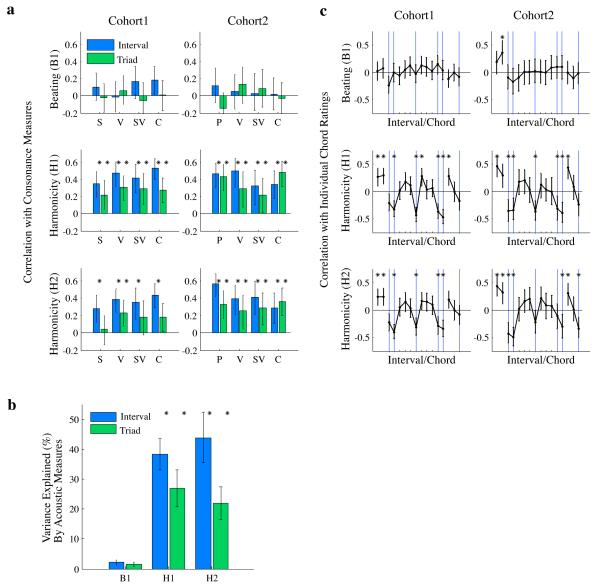
Fig. 3.
Correlations of beating and harmonicity preferences with consonance preferences. (A) Correlations with interval and triad consonance measures. Letters on x-axis denote note timbre (saxophone (S), sung vowels (V), synthetic sung vowels (SV), synthetic complex tone (C), pure tone (P)). Here and in (C), error bars denote 95% confidence intervals, and asterisks denote significance (.05 criterion). (B) Variance of consonance measures explained by acoustic preferences. Error bars denote standard errors. Asterisks indicate that the variance explained by a harmonicity preference was significantly greater than that for the beating preference measure (.05 criterion, sign test). (C) Correlations with ratings of individual chords, averaged across note timbre. Interval/chord arrangement within subpanels follows conventions of Figure 1a. Blue vertical lines denote dissonant intervals and triads included in consonance measures. See also Figs. S2, S3.

